Public Funding for Arts and Culture in 2020
Download:![]() Arts Funding Snapshot: GIA’s Annual Research on Support for Arts and Culture (1.1Mb)
Arts Funding Snapshot: GIA’s Annual Research on Support for Arts and Culture (1.1Mb)
Public funding for the arts in the US is allocated from federal, state, and local governments. Congressional allocations to the NEA, legislative appropriations to state arts agencies and local government funds going to local arts agencies reported in Fiscal Year (FY) 2020 provide useful indicators of public support for the arts and culture before the Covid-19 pandemic. Together, these agencies and organizations distribute grants and services to artists and cultural organizations across the nation.
2020 Funding Levels
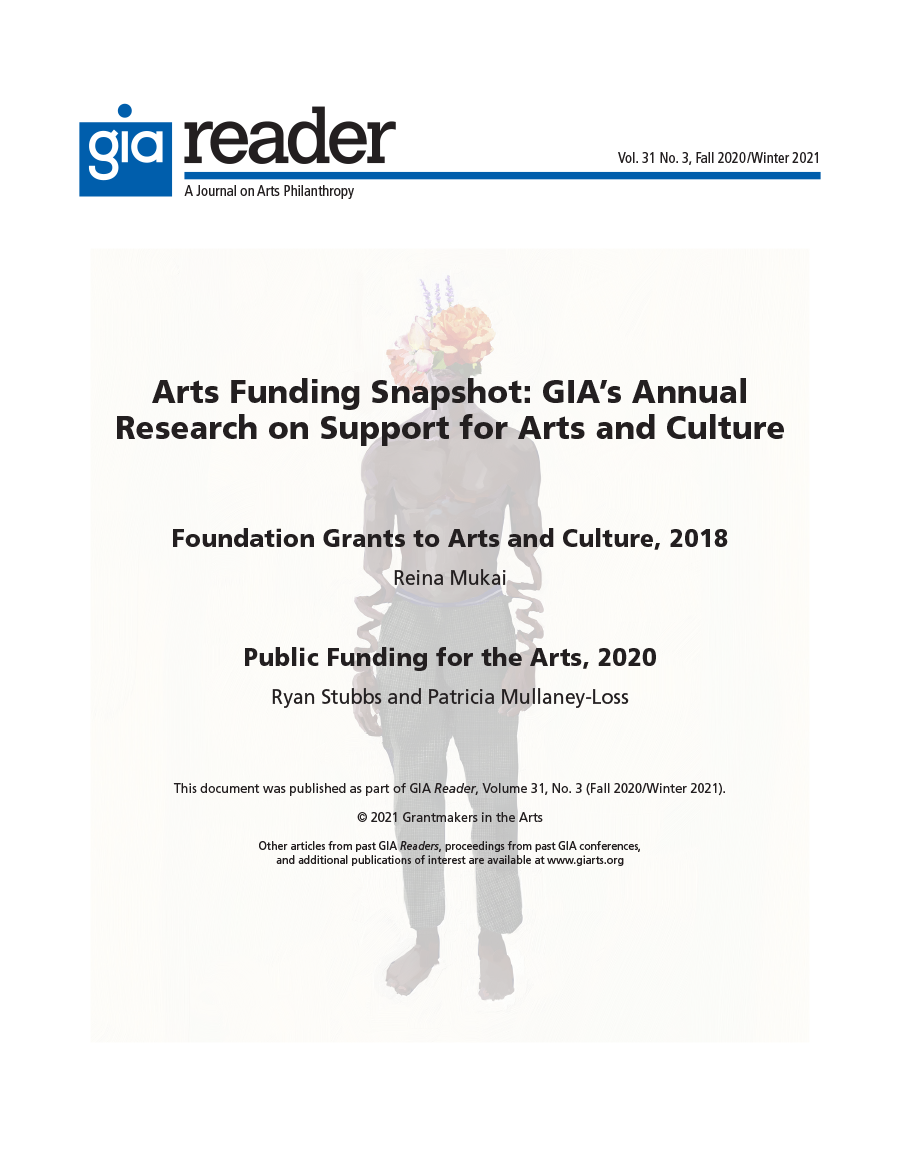
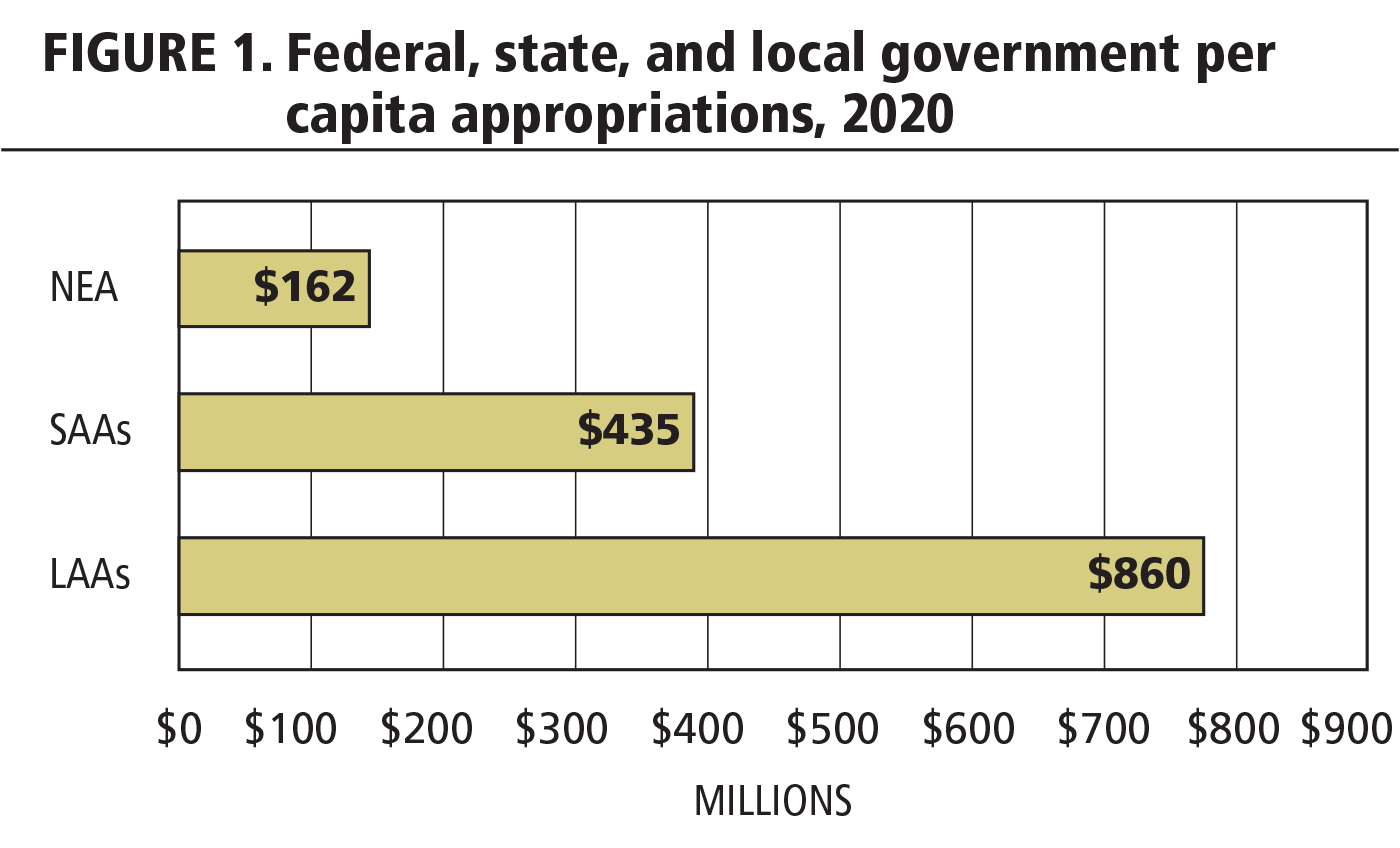
The federal government, states, and localities appropriated a combined $1.47 billion to the arts in FY2020, for a total per capita investment of $4.42. Comprising this total were:
- $162.3 million in appropriations to the NEA, an increase of 4.7% from FY2019.
- $435.4 million in legislative appropriations to state and jurisdictional arts agencies (SAAs), an increase of 21% from FY2019.
- $860.0 million in funds allocated by municipal and county governments to local arts agencies (LAAs),1 which remained flat from FY2019.
Trends over Time
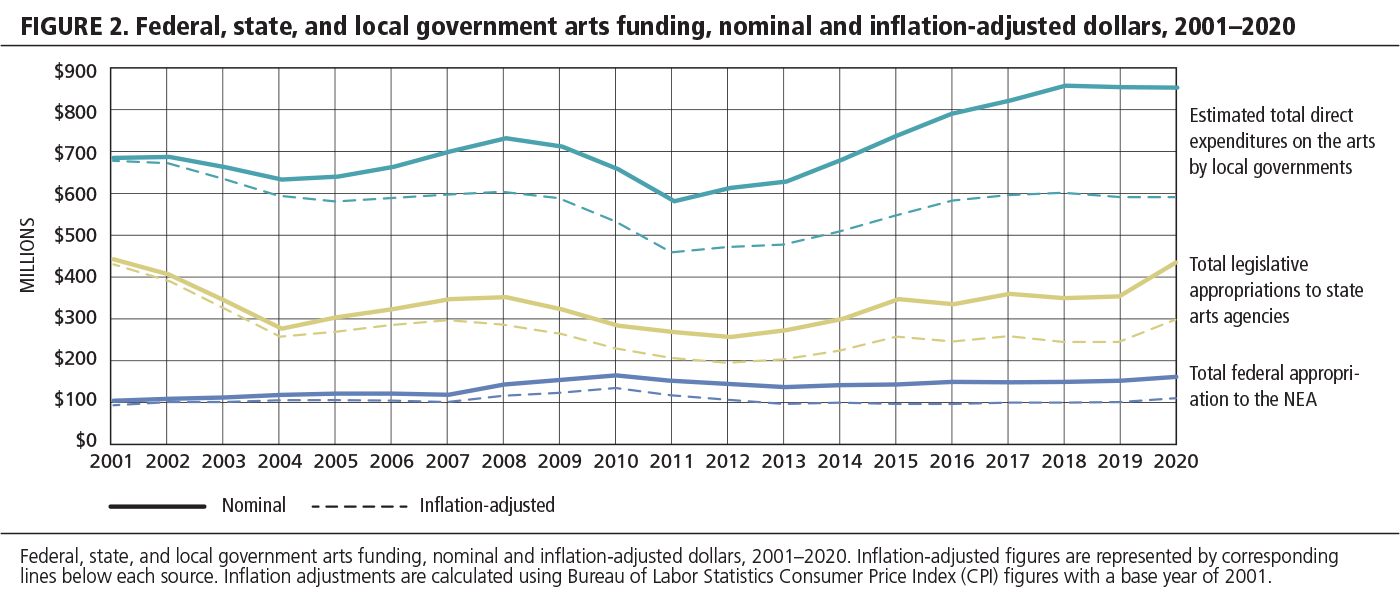
Before the pandemic, aggregate funding for the arts reached a new high water mark of the last two decades, an increase of almost 17% during the past 20 years. State and local funding patterns correlate with periods of economic growth and recession. After the longest economic expansion in recent history,2 enacted appropriations almost surpassed the FY2001 funding levels (without adjusting for inflation). Local funding reported maintaining a historic high point over the last two fiscal years. Federal funding for the NEA has displayed incremental growth after sustaining cuts during the last recession.
Public funding for the arts has not kept pace with inflation despite nominal increases. When adjusting for inflation, total public funding decreased by 19% during the past 20 years. In constant dollar terms, state arts agency appropriations decreased by 33%, local funding contracted by 14%, and federal funds have increased by 7%.
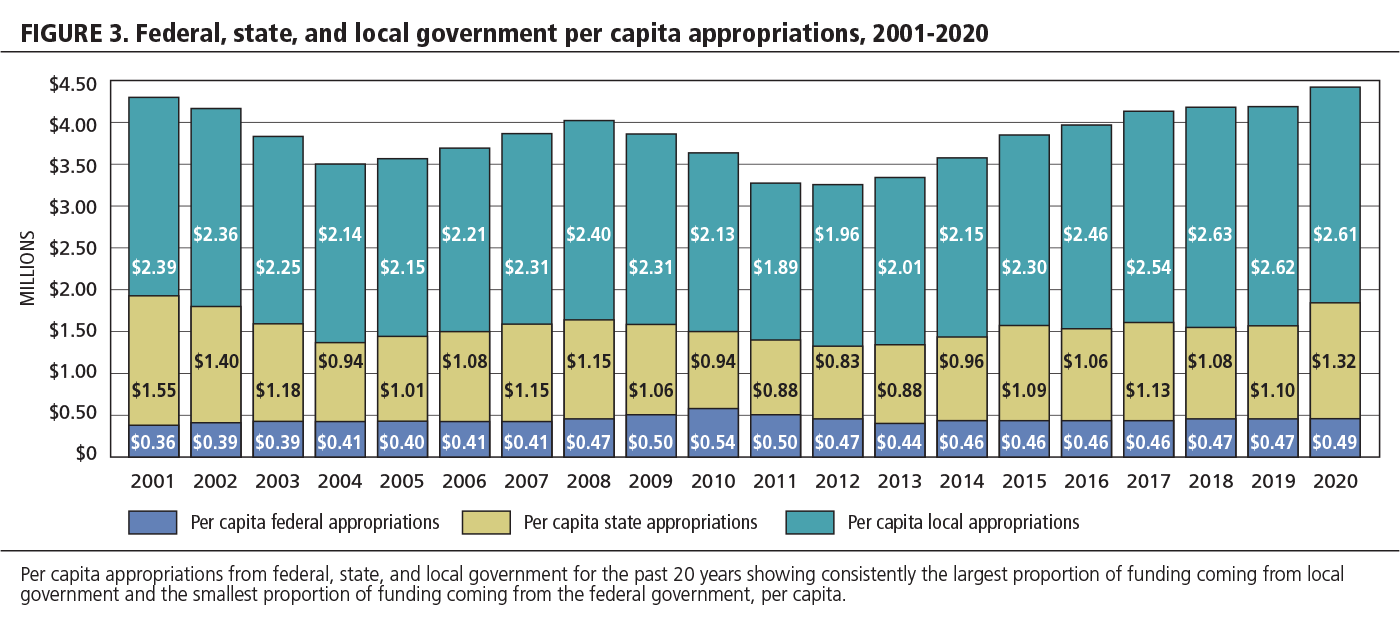
Serving a Growing Population
Inflation measures how far each dollar stretches today compared to decades past. Measuring public funding relative to the population shows how much each tax dollar is stretched to benefit all residents. As populations grow, public arts agencies need to serve more people. Combined, federal, state, and local arts funding yielded a per capita investment of $4.42 per person in 2020. Federal, state, and local funding each contribute $0.49, $1.32, and $2.61, respectively. Combined per capita appropriations have been increasing since 2012 and just surpassed nominal 2001 in FY2020. When taking inflation into consideration, total per capita appropriation equaled $3.06 in 2020. This analysis shows that the decreasing value of the dollar, coupled with an increasing population, limits the services and programs public agencies can deliver to constituents.
Looking Forward and the Implications of Covid-19
Before the pandemic hit the US last February, the majority of states were expecting positive revenue increases to continue into FY2021. Following a decade of economic expansion, states were at an all-time aggregate high in rainy-day funds and were better off financially than they were before the Great Recession. However, in the wake of Covid-19, state revenues declined for the first time since the Great Recession. All states are experiencing or expecting significant budget cuts and the worse is yet to come as state tax collections and state spending are slower to respond to economic cycles. Since most states have balanced budget restrictions, cuts are expected to be as high as 15–20% in the next two fiscal years.3 The Center for Budget and Policy priorities estimates that state budget shortfalls could reach $400 billion by FY2022,4 particularly if the federal government issues no further direct state relief.5 This estimate does not account for the rise in healthcare costs related to Covid-19, nor the sustained assistance citizens need during the ongoing pandemic.
Appropriations to state art agencies are directly linked to state revenue. Based on preliminary estimates for FY2021, aggregate funding to states arts agencies is projected to significantly decrease. Thirty-six states will likely experience flat or decreased funding, compared to 17 in FY2020. Additionally, 32 states are expected to invest less than $1.00 per capita for the arts.6
In Americans for the Arts’ Local Arts Agency 2019 Census, 64% of LAAs reported operating budgets increasing or remaining flat.7 However, given FY2020 and FY2021 financial realities, one can expect fewer budget increases for LAAs over the next few years. Most of LAA’s revenue is derived from earned or contributed income and from local government revenue. All of these sources are expected to decrease in the wake of the recession. Local governments in particular have been hit hard with Covid-related expenses. According to a survey by the National League of Cities, general fund revenue growth was near zero in FY2020 and 90% of cities surveyed will be less able to meet the fiscal needs of residents.8
States and localities are looking to the federal government for relief and assistance during this crisis. At the time of this writing, the Congress has passed two Covid-relief bills, but has not passed a full FY2021 budget. The first stimulus bill, the Coronavirus Aid, Relief, and Economic Security (CARES) Act passed back in March, gave additional funds to the NEA for emergency grants and direct funding to states. Further details on how CARES funding has affected the arts and cultural sector is detailed below. Congress recently passed a second Covid stimulus bill that includes direct aid to individuals, but no additional aid for states and localities.
Federal support through the CARES Act has been an important part of the toolkit that federal and state governments are using to address losses caused by Covid-19 in the cultural sector. The CARES Act included $75 million in funds distributed through the NEA granted to arts organizations directly. By law, 40% of those dollars were allocated to SAAs and regional arts organizations, which are regranting them through state level arts relief programs. Apart from these funds, the CARES Act also included $150 billion in aid to states and localities. Some states elected to use some of these funds for grants or loans to mitigate economic harm caused by the pandemic. At the time of this publication, 29 states are in the process of tapping into this aid for the cultural sector. Most of these CARES Act dollars are going to emergency relief grants for organizations and individuals in the cultural sector. In the upcoming year, it is likely that more states will allocate portions of federal relief funding to arts institutions and artists, but that is also contingent on whether further federal relief is distributed states and localities in 2021.
Implications for Grantmaking
Over the last ten months, public and private sectors have had to adapt to new public health and economic realities. Aside from the additional federal assistance to the cultural sector described above, agencies at all levels of government have had to modify existing grant programs or quickly create new grants to serve organizations and individuals in crisis. Grantmaking adaptations due to the pandemic have yielded a range of strategies to serve constituents in need. Universally, SAAs allowed for flexibility in the administration of grant funds for programs that were suddenly unable to be conducted as originally conceived. Examples of adaptations included: allowing grantees to utilize project support for operating support; allowing for proposed programming to switch from in-person to online activities; extending deadlines over a longer period; and reducing matching requirements. At the federal level, the NEA allowed for flexibilities such as deadline extension and reasonable programmatic adjustments. Public funders are also grappling with the extent to which program adjustments should be continued in a post-Covid environment.
Before the pandemic, direct federal grants from the NEA totaled 2,227 at $55.9 million in FY2019. Another $51.5 million, or about 40% of the NEA’s appropriation, was awarded to state and regional agencies for further grantmaking and related services. SAAs awarded 24,984 grants and $315.1 million in award dollars in FY2019 using a combination of state and federal funds.
In turn, state arts agencies work in partnership and provide funding and services with many local government arts agencies. SAAs invest almost $37 million in local arts agencies. These grants help them secure additional public and private dollars at the local level.9 A large portion of SAA grants to local agencies (31%) is for operating support — flexible dollars that can be used to support community arts activities and operations in accordance with local needs and circumstances.10 In addition to funding performances, exhibitions, and other programs, some SAAs also fund decentralized grantmaking through local arts agencies.
Local governments invest more dollars on arts and culture when compared to states and the NEA, but LAAs are less likely to focus their services on grantmaking. According to the 2019 local arts agency census, 58% of local arts agencies operate direct grantmaking programs.11 Larger percentages of LAAs support direct culture programming (84%) and manage cultural facilities (62%), while 28% also provide non-grant contracts to organizations.
Grantmaking across Sectors
Grantmaking across public and private sectors provide funding for a diverse array of programs, organizations, and services. However, there is not an exact alignment when comparing data. LAAs, for instance, do not currently use a standard data collection process across the nation. To understand relative investments across public and private funders, we can use published data from state arts agencies, the NEA, and Candid’s 2018 data on the 1,000 largest foundations.
Like per capita calculations, analyzing the number and size of awards proves useful when assessing how public funds serve the entire population. The distribution of grants from publicly funded art agencies reflect the priority of reaching more communities across the country. In order to reach more constituents with the amount of appropriations a public entity receives, many of these grants will be small in size. To illustrate this, SAAs have a median award value of $5,000. Although the median award amount from the NEA is $20,000, 51% of all awarded NEA grants are less than $25,000 in size. In contrast, the 1,000 largest foundation award higher levels of grant dollars, 92% of which are above $50,000.
Another important point of comparison is types of support strategies employed by public and private funders. Foundations and SAAs make significant grant investments in operating support. Foundations spent approximately 25% of their arts and culture grant dollars on operating support in 2018. In terms of the percentage of dollars invested, both foundations and SAAs make the largest commitment to operational support — 30.5% of state arts agency grant dollars and 20% of all state arts agency awards went to operational supporting FY2019.
Although the NEA’s statute prohibits the agency from awarding operating support grants, over $50 million dollars are invested in SAAs and regional art organizations. These dollars enable state and local arts agencies to make investments in operating support by increasing the total dollars agencies have available for grants and services.
Outside of operating support, it is possible to compare a few other grant categories and activity types. Foundations, SAAs, and the NEA all make investments in museums and arts education. A key contrast between public and private sectors is investment in capital construction and physical infrastructure. Foundations bear the load for funding physical cultural infrastructure in the US, with 14% of foundation grant dollars going to capital and infrastructure.
Another challenging topic for grantmakers is investment in individual artists and fellowships.12 At the local level, 39% award grants to individual artists and 42% of LAAs provide non-grant contracts to individual artists. In FY2019, state arts agencies made 2,600 awards to individual artists.13 When compared to other types of applicants, awards to individual artists were the second most frequent type of award made by SAAs. The NEA makes a few selected investments in individual artists — through National Heritage Fellows, Jazz Masters, and Literature Fellowships — but is otherwise statutorily restricted from awarding grant funds to individual artists. Private foundations also fund individuals, but comparison data is not available.
Private and public funders fulfill different roles within the arts and cultural ecosystem. This complimentary array of support strategies is necessary for the cultural sector to thrive. While the private sector provides the lion’s share of support, public funds support different grantmaking patterns to reach the needs of their constituencies and public mandates.14 Government support at the federal, state, and local levels makes access to arts and culture across the nation possible.
Ryan Stubbs is senior director of research at the National Assembly of State Arts Agencies.
Patricia Mullaney-Loss is a research associate at the National Assembly of State Arts Agencies.
NOTES
- Americans for the Arts substantially changed the methodology for collecting local arts agency investments through the local arts agency census in 2016. Annual estimates are used prior to 2011 and after 2016.
- https://www.nber.org/research/data/us-business-cycle-expansions-and-contractions
- http://budgetblog.nasbo.org/budgetblogs/blogs/shelby-kerns1/2020/09/08/state-revenues-decline-for-first-time-since-the-gr
- https://www.cbpp.org/research/state-budget-and-tax/pandemics-impact-on-state-revenues-less-than-earlier-expected-but
- http://budgetblog.nasbo.org/budgetblogs/blogs/shelby-kerns1/2020/09/08/state-revenues-decline-for-first-time-since-the-gr
- Trend data on legislative arts funding in every state and jurisdiction can be found at https://nasaa-arts.org/nasaa_research/8306/.
- https://www.americansforthearts.org/sites/default/files/pdf/2019/networks_and_councils/local_arts_network/profile/2019_LocalArtsAgencyProfile_FullReport_FINAL.pdf
- NCL, City Fiscal Conditions 2020 https://www.nlc.org/wp-content/uploads/2020/08/City_Fiscal_Conditions_2020_FINAL.pdf
- https://nasaa-arts.org/wp-content/uploads/2017/03/LAA-Grant-Making-Fact-Sheet.pdf
- National Assembly of State Arts Agencies, Support for Local Arts Agencies, FY2019. https://nasaa-arts.org/nasaa_research/laa-grant-making-fact-sheet/
- Americans for the Arts, Local Arts Agency Profile, 2019 https://www.americansforthearts.org/sites/default/files/pdf/2019/networks_and_councils/local_arts_network/profile/2019_LocalArtsAgencyProfile_FullReport_FINAL.pdf
- Grantmakers in the Arts, Support for Individual Artists http://www.giarts.org/support-individual-artists
- NASAA, State Arts Agency Support for Individual Artist Fact Sheet https://nasaa-arts.org/nasaa_research/indivartistgrantmakingfactsheet0316/
- Andrew W. Mellon Foundation, Better Together; Public and Private Funding for the Arts, Pam Breaux https://mellon.org/resources/shared-experiences-blog/better-together-public-and-private-funding-arts/