Public Funding for the Arts: 2015 Update
The arts in America are supported by a complex mix of funds, including individual contributions, corporate and foundation support, earned revenues, and government grants. Although government funds comprise a modest percentage of total arts income, they are an essential part of the American arts ecosystem, supporting community arts development, achieving a wide geographic dispersal of grants, and making arts funds accessible to communities that may have limited access to other resources.
To quantify public funding for the arts in the United States over time, it is useful to monitor three key indicators: congressional allocations to the National Endowment for the Arts (NEA), legislative appropriations to the nation’s state arts agencies, and direct expenditures on the arts by county and municipal governments. Investments in and through these agencies have been the primary mechanisms for public sector arts grantmaking for fifty years.
2015 marked a third straight year of increased public funding for the arts when accounting for federal, state, and local sources. In each year since 2012, aggregate figures have increased, though gains have come only from state and local appropriations and expenditures. Federal funds have remained nearly unchanged, while state and local funds are slowly increasing again in the wake of the Great Recession. Combined public funding sources remain below pre-recession levels measured in 2008.
2015 Funding Levels
The federal government, states, and localities appropriated a combined $1.33 billion to the arts in FY2015, for a total per capita investment of $4.13. Comprising this total were
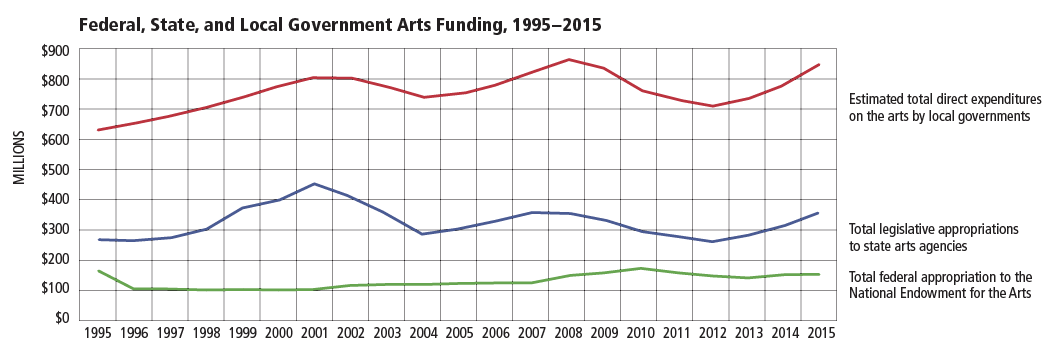
- $146 million in appropriations to the NEA, the same level of NEA funding as in the past. (Note that this appropriation would have represented flat funding for the past four years without the sequestration reductions in fiscal year 2013.)
- $349 million in legislative appropriations to state and jurisdictional arts agencies, an increase of 13.7 percent from FY2014.
- an estimated $840 million in direct expenditures on the arts by county and municipal governments, an increase of 8.1 percent from FY2014.
Trends over Time
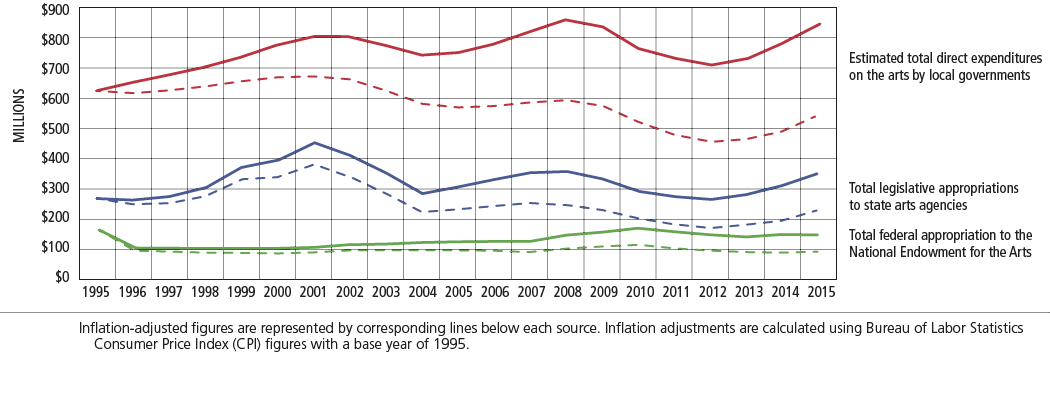
In nominal dollars (not adjusted for inflation), public funding for the arts by federal, state, and local governments increased by 26 percent over the past twenty years. State and local funding patterns have largely corresponded with periods of economic growth and recession. State arts agency aggregate appropriations reached a high point in 2001, and local funding reached an apex in 2008. Federal funding for the NEA has displayed incremental growth after sustaining large cuts in the mid-1990s.
Despite these nominal dollar increases, public funding for the arts has not kept pace with inflation. When adjusting for inflation, total public funding for the arts has actually decreased by 15 percent over this period.
Funding Sources
The NEA receives nearly all of its appropriation from the federal domestic budget, specifically funds allocated by the House and Senate Interior Appropriations Committees during Congress’s annual budget debates. The composition of state appropriations and local support can vary among agencies. At the state level, 78.5 percent of all state arts agency (SAA) appropriations come from state general funds. Some states have instituted dedicated funding mechanisms such as special taxes and fees, arts license plates, and portions of state gaming revenue, to a name a few. However, these revenue sources provided the majority of the agency’s legislative appropriation in only eight of the twenty-six states that currently have dedicated funding mechanisms in place. These mechanisms also are present at the local level, often from mechanisms like hotel occupancy, sales, and property taxes.
Apart from their core appropriations, public agencies also receive some funds from additional mechanisms, both public and private. For instance, the NEA’s FY2014 programming budget of $124.7 million included $1.0 million in transfers from other federal agencies and nonfederal gifts of $1.0 million. For state arts agencies, other miscellaneous sources such as earned income, private and corporate contributions, and foundation grants comprised only 1.4 percent of SAA revenues in FY2015. Local arts agencies (LAAs), which can be either public agencies with municipal government or private nonprofit corporations, stand in contrast to the NEA and SAAs. In FY2009 (the most recent year for which revenue source breakdowns are available for LAAs), local government support comprised 61.9 percent of public LAAs’ total revenues, and only 17.5 percent of private LAAs’ total revenue. Other elements of LAA revenue include private donations, membership dues, foundation grants, and grants and contracts from state and federal government.
Implications for Grantmaking
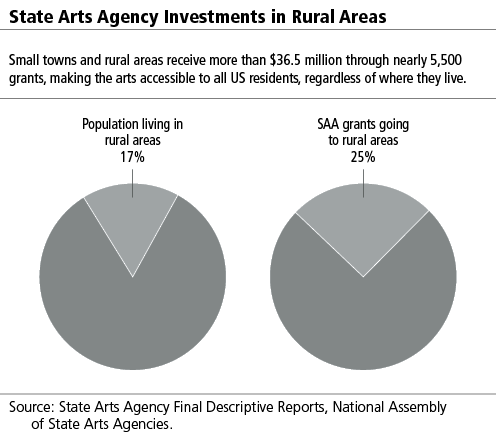
Government dollars have always contributed a relatively small portion of total arts dollars in the United States, but public funds comprise a much higher percentage of support received by small, underserved, rural, and grassroots groups. Analyses by the National Assembly of State Arts Agencies (NASAA) of operational support show that state arts agency grants contribute a larger proportion of revenues for organizations with small budgets. Additionally, the proportion of state agency grants going to rural communities is greater than the proportion of the population living in rural areas. Given these facts, the erosion of public grant dollars and their buying power are likely to have a disproportional effect on small and rural organizations. Government arts funding declines have led to the elimination of numerous grant programs for small and large grantees alike.
Although federal, state, and local grantmaking decisions are made independently, some of those dollars are intentionally designated for regranting to increase local involvement in the distribution of funds and achieve economies of scale in funding very small organizations and projects at the community level. These relationships are affected when flat funding — or funding reductions — in one level of government ripples throughout the system. Forty percent of the NEA’s grant dollars are designated by Congress to go to state and regional arts agencies. In turn, seventeen state arts agencies have decentralized funding mechanisms that provide block grants to local arts agencies designated as regranters. Tens of thousands of arts opportunities across the country are made possible by the combination of these public funds and the matching private revenues associated with them.
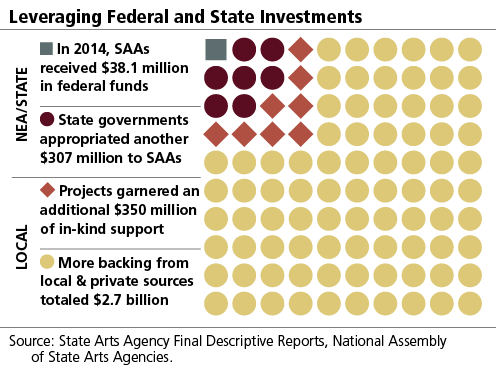
For instance, looking at an analysis of the most recently available SAA grants data from fiscal year 2014, there is no question that SAA grantees leverage significant local and private matching funds that far exceed state and federal funds. Data collected by the NEA suggests a similar effect: the ratio of reported matching dollars to NEA grant funds generally approaches or exceeds 10:1, far surpassing the required minimum match.
The long-term effects of the declines in public support during and after the Great Recession are still emerging. In the meantime, public arts agencies, now having faced numerous periods of drastic funding adjustments, have developed management strategies concomitant with budget tensions. They have become adept at rescaling grant programs to align with fewer and less predictable resources (both financial and human). Advocacy to secure public funds for the arts has become even more important, as has evidence of the return on investment that derives from public arts funds. Securing such evidence is a double-edged sword: it helps to make the case for public funding but also can increase the application and reporting burden for grants that are already small. (The median NEA grant award size is $20,000; the median SAA grant award size is $4,200.) Public arts funders are working to find the right balance to that challenge, further illuminating the economic, civic, cultural, and educational benefits that federal, state, and local support for the arts can achieve.
Note
This profile draws on local spending estimates from Americans for the Arts, NASAA’s legislative appropriations surveys of the nation’s state and jurisdictional arts agencies, Final Descriptive Reports for State Arts Agency grantmaking, and appropriations data from the NEA. As of this writing, the most recent data available about federal and local funding for the arts are from fiscal year 2015. Fiscal year 2016 forecasts for state arts agencies are available from www.nasaa-arts.org. Constant dollar adjustments for inflation are calculated using Bureau of Labor Statistics Consumer Price Index (CPI) figures with a base year of 1995. Per capita calculations are based on national population estimates from the US Census Bureau.