Public Funding for the Arts: 2013 Update
Download:
![]() Arts Funding Snapshot: GIA's Annual Research on Support for Arts and Culture (6.8Mb)
Arts Funding Snapshot: GIA's Annual Research on Support for Arts and Culture (6.8Mb)
Public funding for the arts in the United States continues to originate from three primary sources: federal appropriations to the National Endowment for the Arts (NEA), legislative appropriations to the nation’s state arts agencies, and direct expenditures on the arts by local governments. Fiscal year 2013 was a mixed year for these funding streams. State and local government revenues posted positive gains, but public budgets are still feeling some residual effects of an extended recession, combined with a high degree of uncertainty regarding federal funding. Budget growth for states, counties, and municipalities was therefore limited in FY2013. This pattern in turn affected appropriations to the arts: aggregate appropriations to state and local arts agencies both showed modest increases, while federal appropriations to the NEA declined by 5 percent.
 |
2013 Funding Levels
Fiscal year 2013 is the first time that aggregate measurements of federal, state and local funding streams have increased since FY2008. The federal government, states and localities appropriated a combined $1.14 billion to the arts in FY2013, for a total per capita investment of $3.60. Comprising this total was:
- $139 million in appropriations to the NEA, a decline of 5 percent from FY2012;
- $279 million in legislative appropriations to state and jurisdictional arts agencies, an increase of more than 7 percent from FY2012;
- an estimated $727 million in direct expenditures on the arts by county and municipal governments, an increase of nearly 3 percent from FY2012.
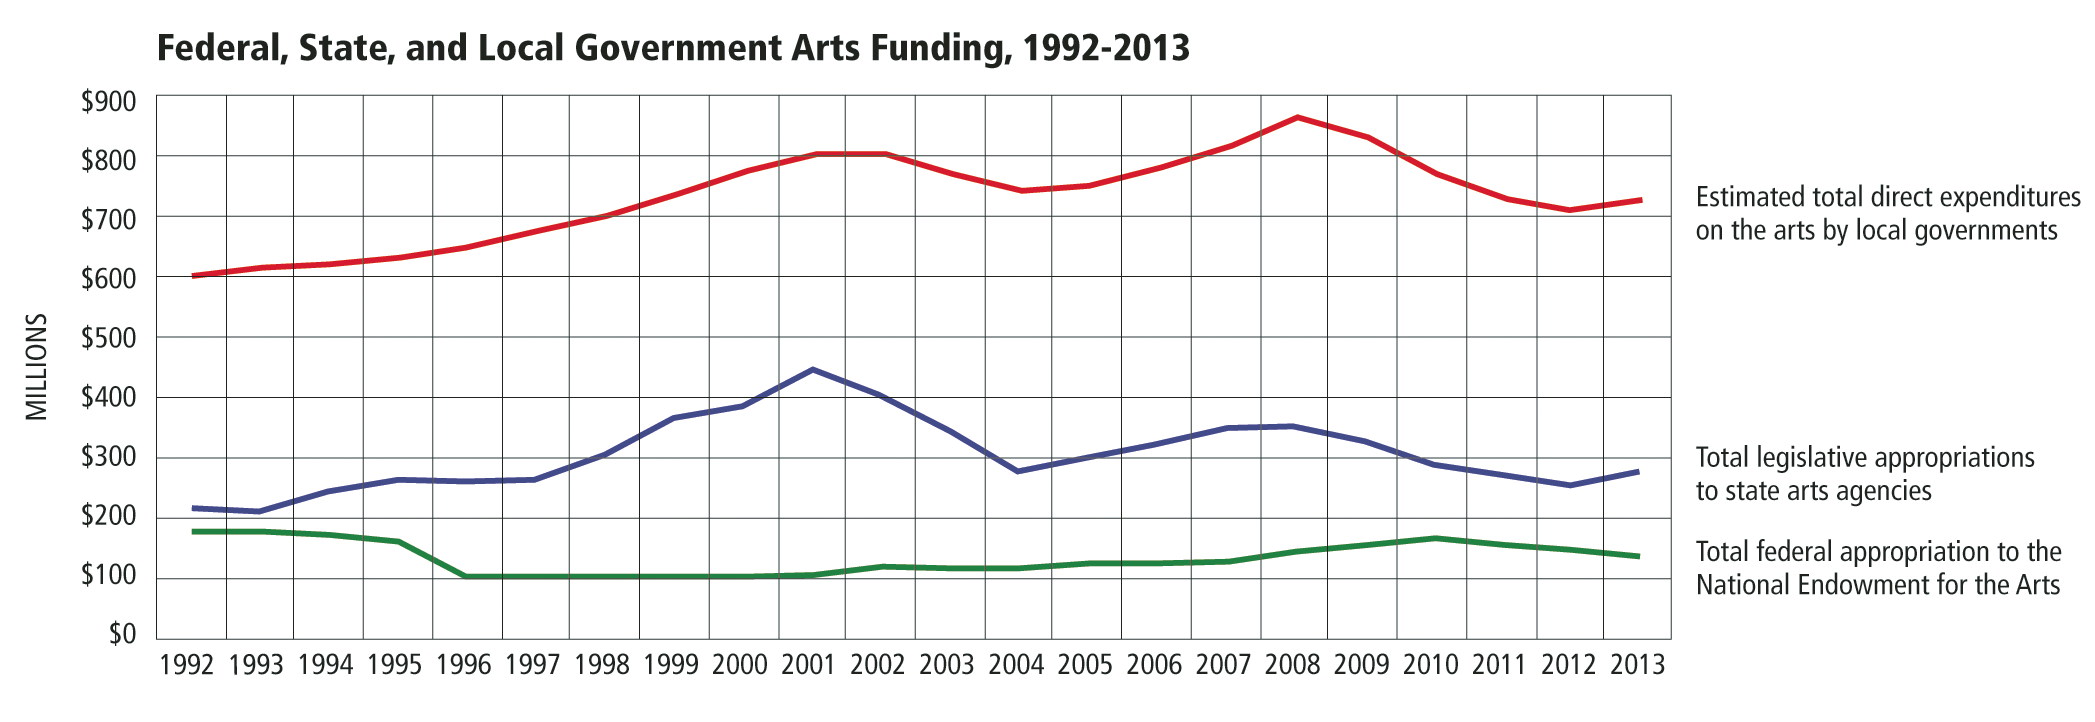
Federal, State, and Local Government Arts Funding, 1992-2013
Federal funding for the NEA this year was affected by the process of cuts to federal domestic and defense spending known as sequestration. These were mandatory, across-the-board spending cuts that affected all federal agencies, including the federal cultural agencies.
Trends over Time
Over the past twenty-one years, total public funding for the arts by federal, state and local governments increased by 15.6 percent. Each layer of government, however, has displayed a slightly different pattern. State and local patterns display similar ebbs and flows corresponding to the economic recessions of the early 2000s and the more recent, longer and deeper recession. Federal funding for the NEA has produced a more consistently flat pattern over this time after sustaining large cuts in the mid-1990s.
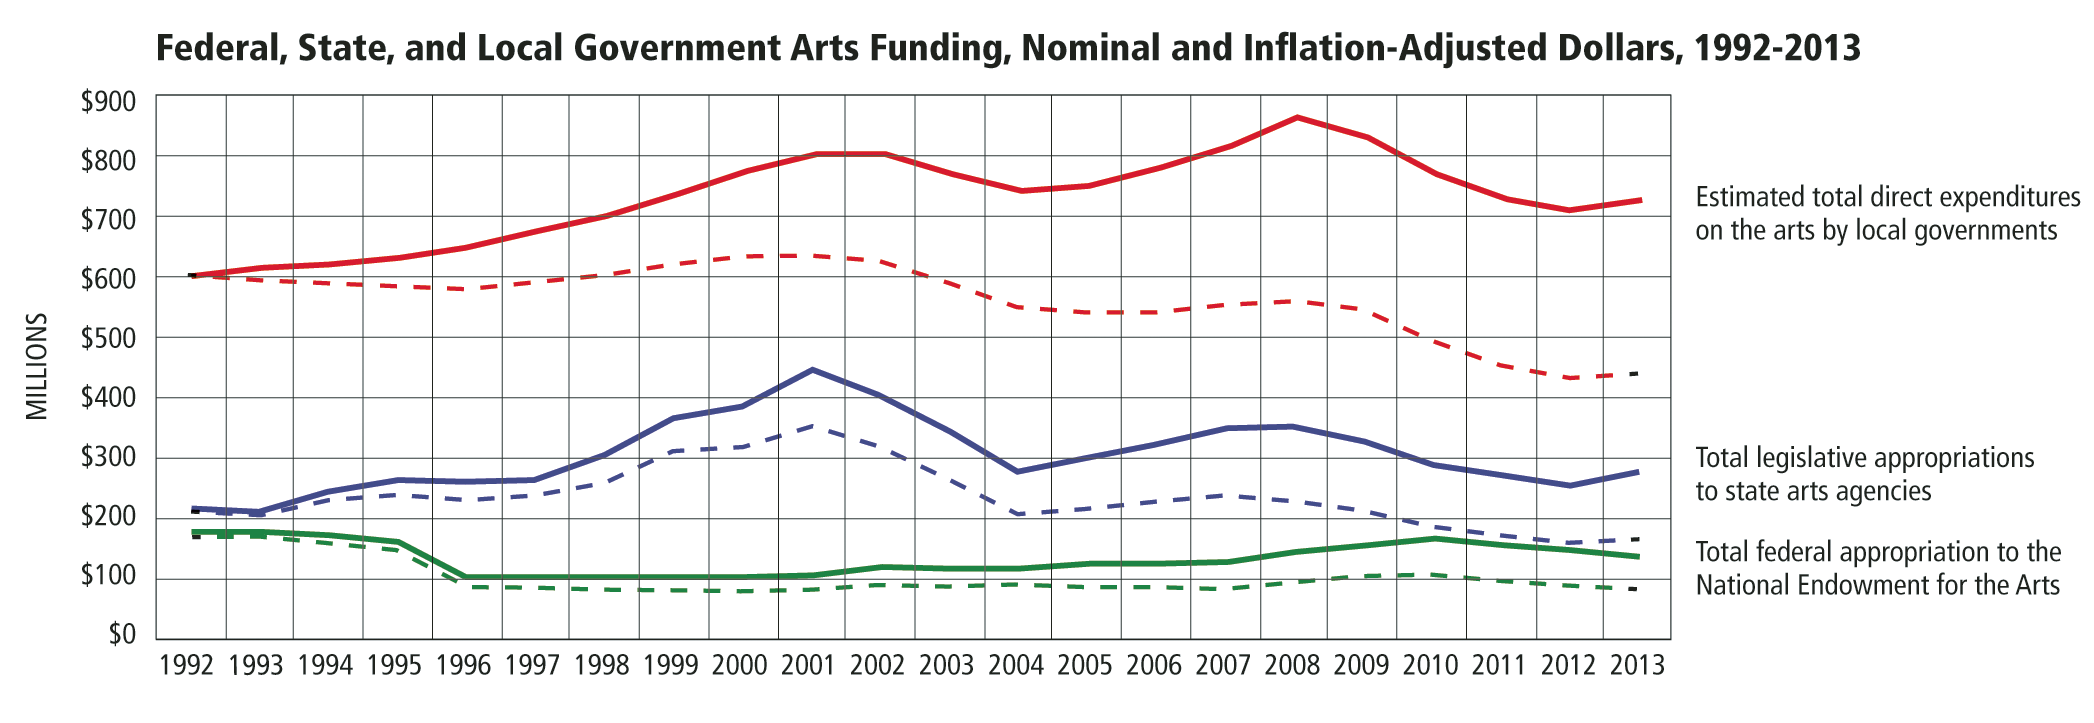 |
Although the nominal increase over the past twenty-one years is positive, the landscape for public funding for the arts in this time period is much bleaker when accounting for inflation. In fact, after adjusting for inflation, public funding for the arts has decreased by more than 30 percent in this same period.
Federal, State, and Local Government Arts Funding, Nominal and Inflation Adjusted Dollars, 1992-2013
Note: Inflation-adjusted figures for each funding source are represented by the corresponding dashed line in the chart on page 18.
Future Outlook
Lingering economic uncertainty, structural weaknesses in public financing systems, and political uncertainty complicate predictions for future public funding of the arts. The advent of ongoing sequestration and intensifying federal budget battles are likely to affect funding for the NEA. Federal cuts also can create a drag on many different aspects of state and local budgets, which could lead to a more challenging overall fiscal climate for many services — including the arts — at other levels of government.
Nevertheless, some early signs point to positive developments for arts funding at the other levels of government in FY2014. Although it is too soon to tell for sure if an arts funding rebound is underway, preliminary data from the National Assembly of State Arts Agencies show that state arts agency revenues are predicted to increase by more than 8.5 percent in FY2014. This would be the second year in a row that state art agency appropriations have increased.
If public sector arts funding continues to rise after experiencing sustained cuts for multiple years, public funders will be presented with yet a new set of challenges. As state and local arts agencies have adapted to climates with bare-bones funding and decreased leveraging power, many grants and services have been stripped down or put on hiatus. Should future funds be used to restore those cuts? Or should new ways of leading the field necessitate different kinds of investments? Public arts agencies are likely to receive pressure from grantees, lawmakers, and the public to do both.
As has always been the case, public funding comprises a modest portion of arts spending in the United States. The NEA reports that the public appropriations, this year estimated at more than $1.14 billion, make up less than 7 percent of total nonprofit arts organization revenue when including earned income and contributions from public and private sources. Public-sector funding is likely to retain this modest but essential role in the arts ecosystem supporting tens of thousands of projects and organizations in every region of the country.
This profile draws on local spending estimates from Americans for the Arts; NASAA’s legislative appropriations surveys of the nation’s state and jurisdictional arts agencies; and appropriations data from the National Endowment for the Arts. As of this writing, the most recent data available about federal and local funding for the arts are from 2013. Fiscal year 2014 forecasts for state arts agencies are available from www.nasaa-arts.org. Constant dollar adjustments for inflation are calculated using Bureau of Labor Statistics Consumer Price Index (CPI) figures with a base year of 1992. Per capita calculations are based on national population estimates from the US Census Bureau.