Public Funding for the Arts, 2017
Download:
![]() Arts Funding Snapshot: GIA’s Annual Research on Support for Arts and Culture (332Kb)
Arts Funding Snapshot: GIA’s Annual Research on Support for Arts and Culture (332Kb)
Public investments in the arts are citizen-driven and beholden to the public interest. They support inclusive experiences and contribute to a robust democratic discourse in American society.
Direct public funding for the arts is understood by tracking congressional allocations to the National Endowment for the Arts (NEA), legislative appropriations to state arts agencies, and local government funds going to local arts agencies. These entities distribute public grants and services to artists, creatives, and cultural organizations across the nation.
2017 Funding Levels
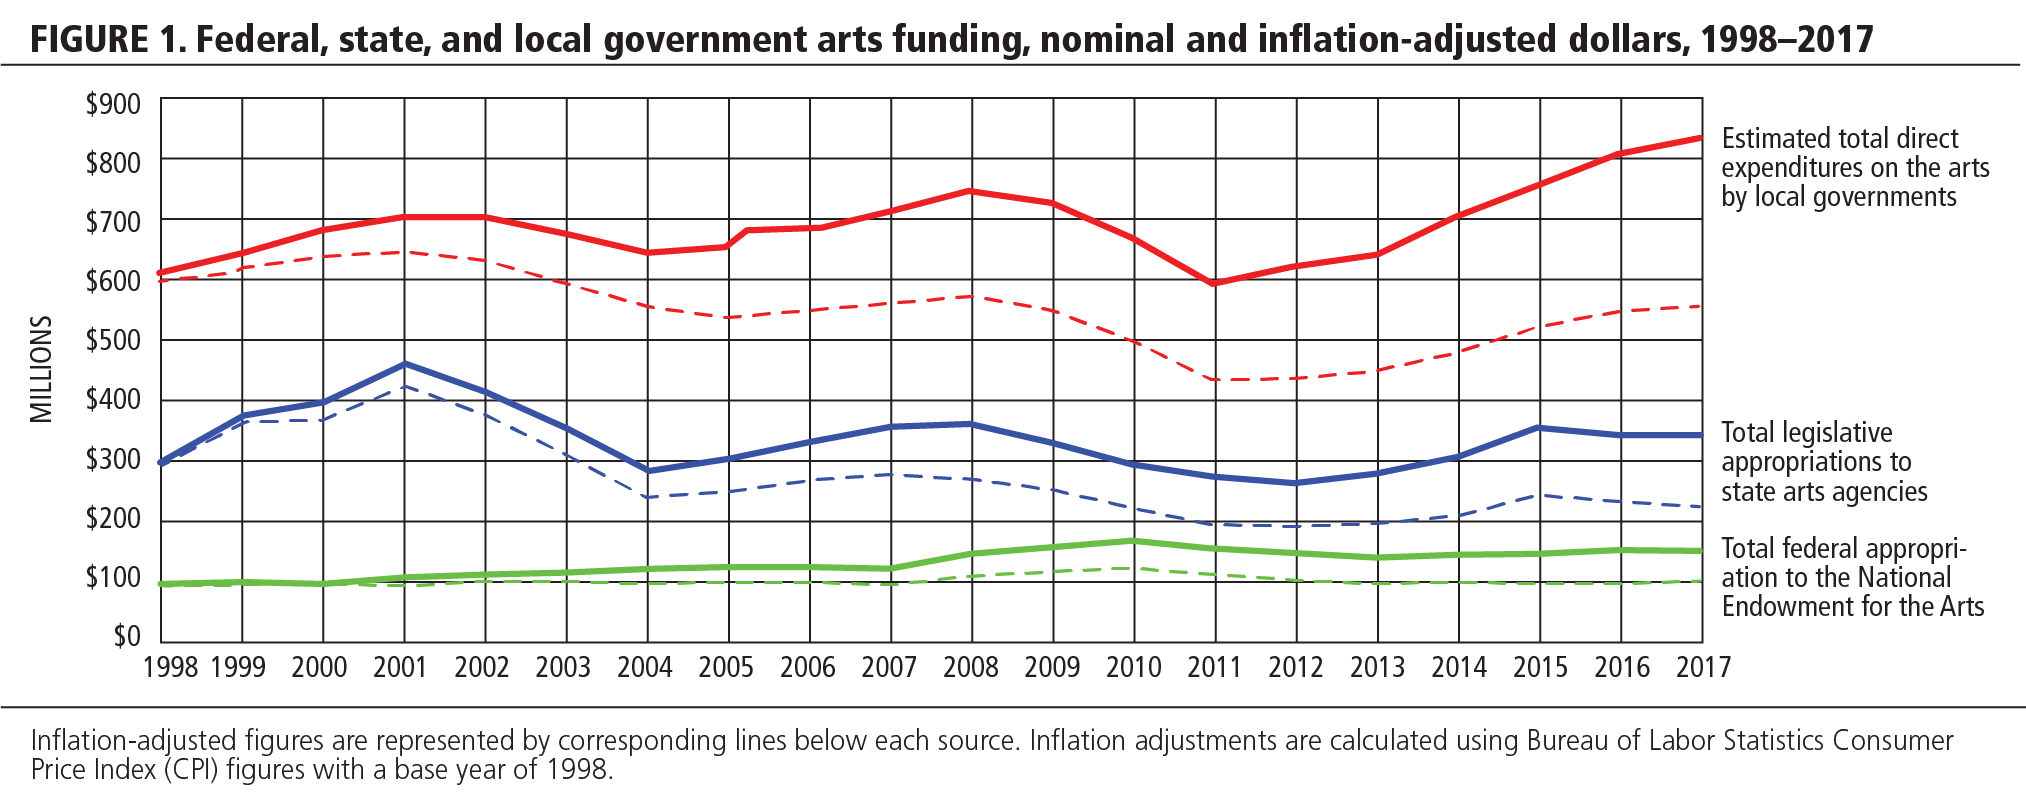
The federal government, states, and localities appropriated a combined $1.32 billion to the arts in FY2017, for a total per capita investment of $4.05. Comprising this total were
- $149.9 million in appropriations to the NEA, an increase of 1.32 percent from FY2016;
- $341.4 million in legislative appropriations to state and jurisdictional arts agencies, an increase of 0.15 percent from FY2016; and
- $827.0 million in funds allocated by local governments to local arts agencies,1 an increase of 4 percent from FY2016.
Trends over Time
In nominal dollars (not adjusted for inflation), public funding for the arts increased by 31 percent over the past twenty years. State and local funding patterns correlate with periods of economic growth and recession. State arts agency aggregate appropriations reached a high point in 2001, while local funding reported a historical high point this year. Federal funding for the NEA has displayed incremental growth after sustaining large cuts in the mid-1990s.
Despite these nominal dollar increases, public funding for the arts has not kept pace with inflation. When adjusting for inflation, total public funding decreased by 12.8 percent over the past 20 years. In constant dollar terms, state arts agency appropriations decreased by 25 percent, local funding contracted by 9 percent, and federal funds have remained essentially flat, increasing by 1.7 percent.
In March 2017, the White House budget recommended the elimination of all funding for the NEA and other federal cultural agencies beginning in fiscal year 2018. Such a shift would cause damaging ripple effects across the arts ecosystem. However, the White House cannot enact budgets unilaterally; Congress holds the ultimate authority for appropriations. As of this writing, the federal budget for fiscal year 2018 has not been resolved, but actions to date by both the House and Senate reflect a strong interest in continuing federal support for the NEA in 2018.
Implications for Grantmaking and Policy
Public arts appropriations (and, by extension, available grant dollars) rise and fall in accordance with government fiscal conditions, particularly revenue projections. For example, trends in state arts agency (SAA) grantmaking track closely with appropriations to state arts agencies over time.2 When SAA appropriations declined by 26 percent during the Great Recession between 2008 and 2012, SAA grant outlays declined by a nearly identical 27 percent.
An amalgamation of public policies and philanthropic practices influence grantmaking in the arts. This amalgamation allows for a variety of funding types and opportunities available from different types of grantmakers. Influence comes from policymakers and national service organizations, but the system is responsive to constituencies, stakeholders, and organizational needs. The confluence of efforts to bring the arts into the lives of as many individuals as possible is not always clean, but data indicate that government and private funders are filling roles and responding to public needs.
Private funders contribute the largest amount of dollars to artists and cultural organizations in the United States. In 2014, foundation funding for the largest 1,000 foundations totaled approximately $2 billion dollars and 16,545 arts and culture grants. The Foundation Center estimates that there are approximately 87,000 total active foundations in the United States, which gave a total of $60.2 billion in 2014. Out of the 1,000 largest foundations, 8 percent of all dollars went to arts and culture. Information about a sample of the largest foundations cannot be applied to all foundations, but total foundation giving to the arts is larger than this sample. In practice, these privately generated dollars are spread out among a large number of individual foundations with their own initiatives and agendas.
In the public sector, grantmaking policies are independently set at the national, regional, state, and local levels. The NEA has the power to allocate funds going to local projects and organizations, but the NEA does not set the policies and practices of state and local arts agencies. Nevertheless, the NEA plays a strong leadership role in influencing cultural policies throughout the United States. For example, more states are aware of and are actively pursuing arts and military strategies because of the NEA’s Creative Forces program.3 The NEA catalyzes cross-sector work, creative aging programs, creative placemaking, and field research. Additionally, 40 percent of the NEA’s program budget goes directly to state arts agencies, which engage in periodic strategic planning to better serve all populations, especially underserved communities. State arts agencies in turn fund local governments and provide much-needed operating support to nonprofit arts organizations. The NEA’s power to leverage state and local funds and its leadership role in the field go far beyond the agency’s very modest appropriation.
Local governments spend the most dollars on arts and culture when compared to states and the NEA, but local arts agencies are less likely to focus their services on grantmaking. According to the 2015 local arts agency census from Americans for the Arts, 53 percent of local arts agencies provide direct community investment in local artists or arts organizations. Larger percentages of local arts agencies support direct culture programming, such as public art and festivals, as well as service provision, such as arts marketing. Ninety-two percent of local arts agencies that are involved in grantmaking support cultural and artistic programming, and 49 percent provide operating support.
Comparative Data between Sectors
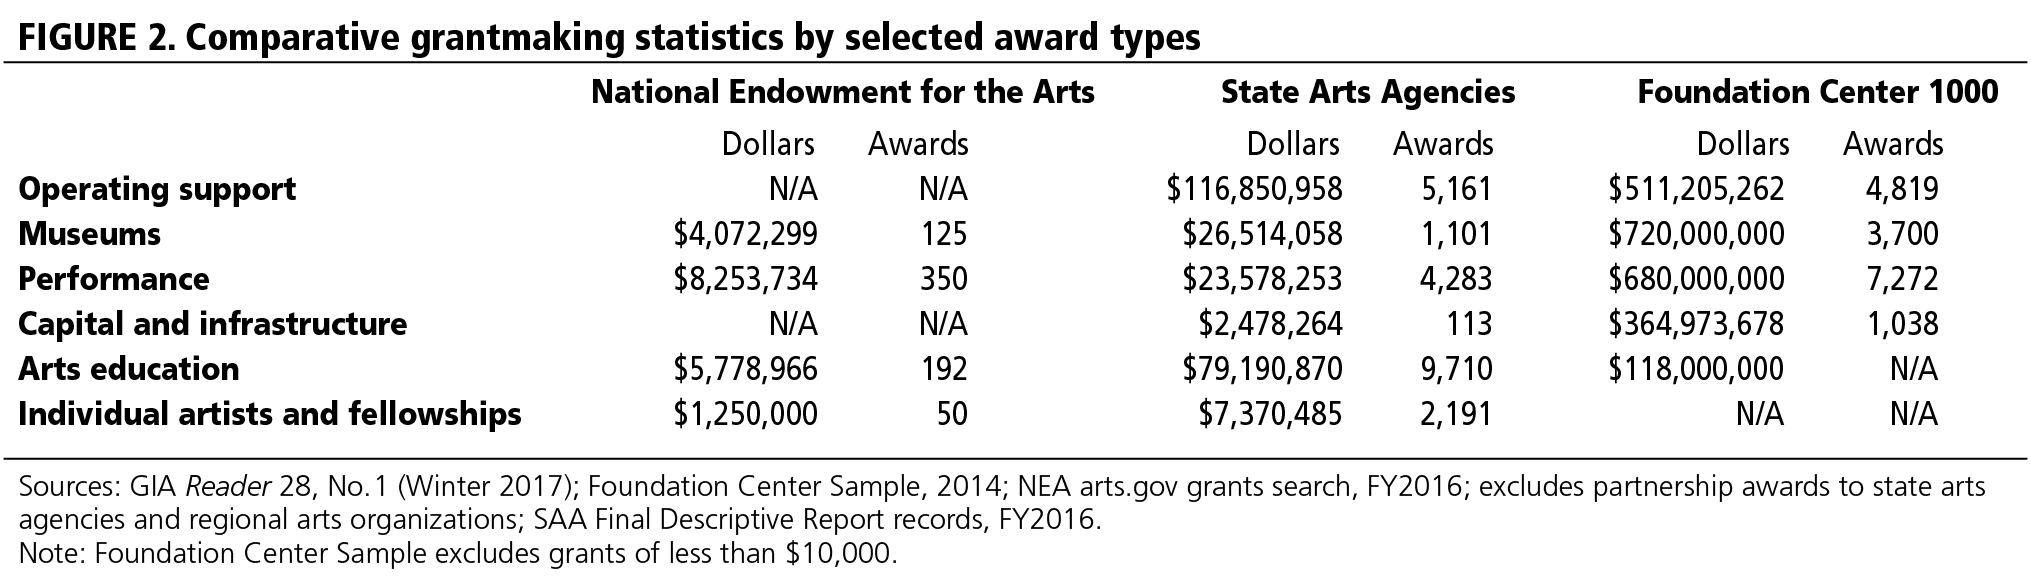
With this amalgamation of grantmaking policies and agendas, it is difficult to match up comparative data across sectors. For example, there are not standardized data collection practices across local arts agencies. However, using published data from state arts agencies, the NEA, and the 1,000 largest foundations, we can approximate relative investments for a handful of categories.
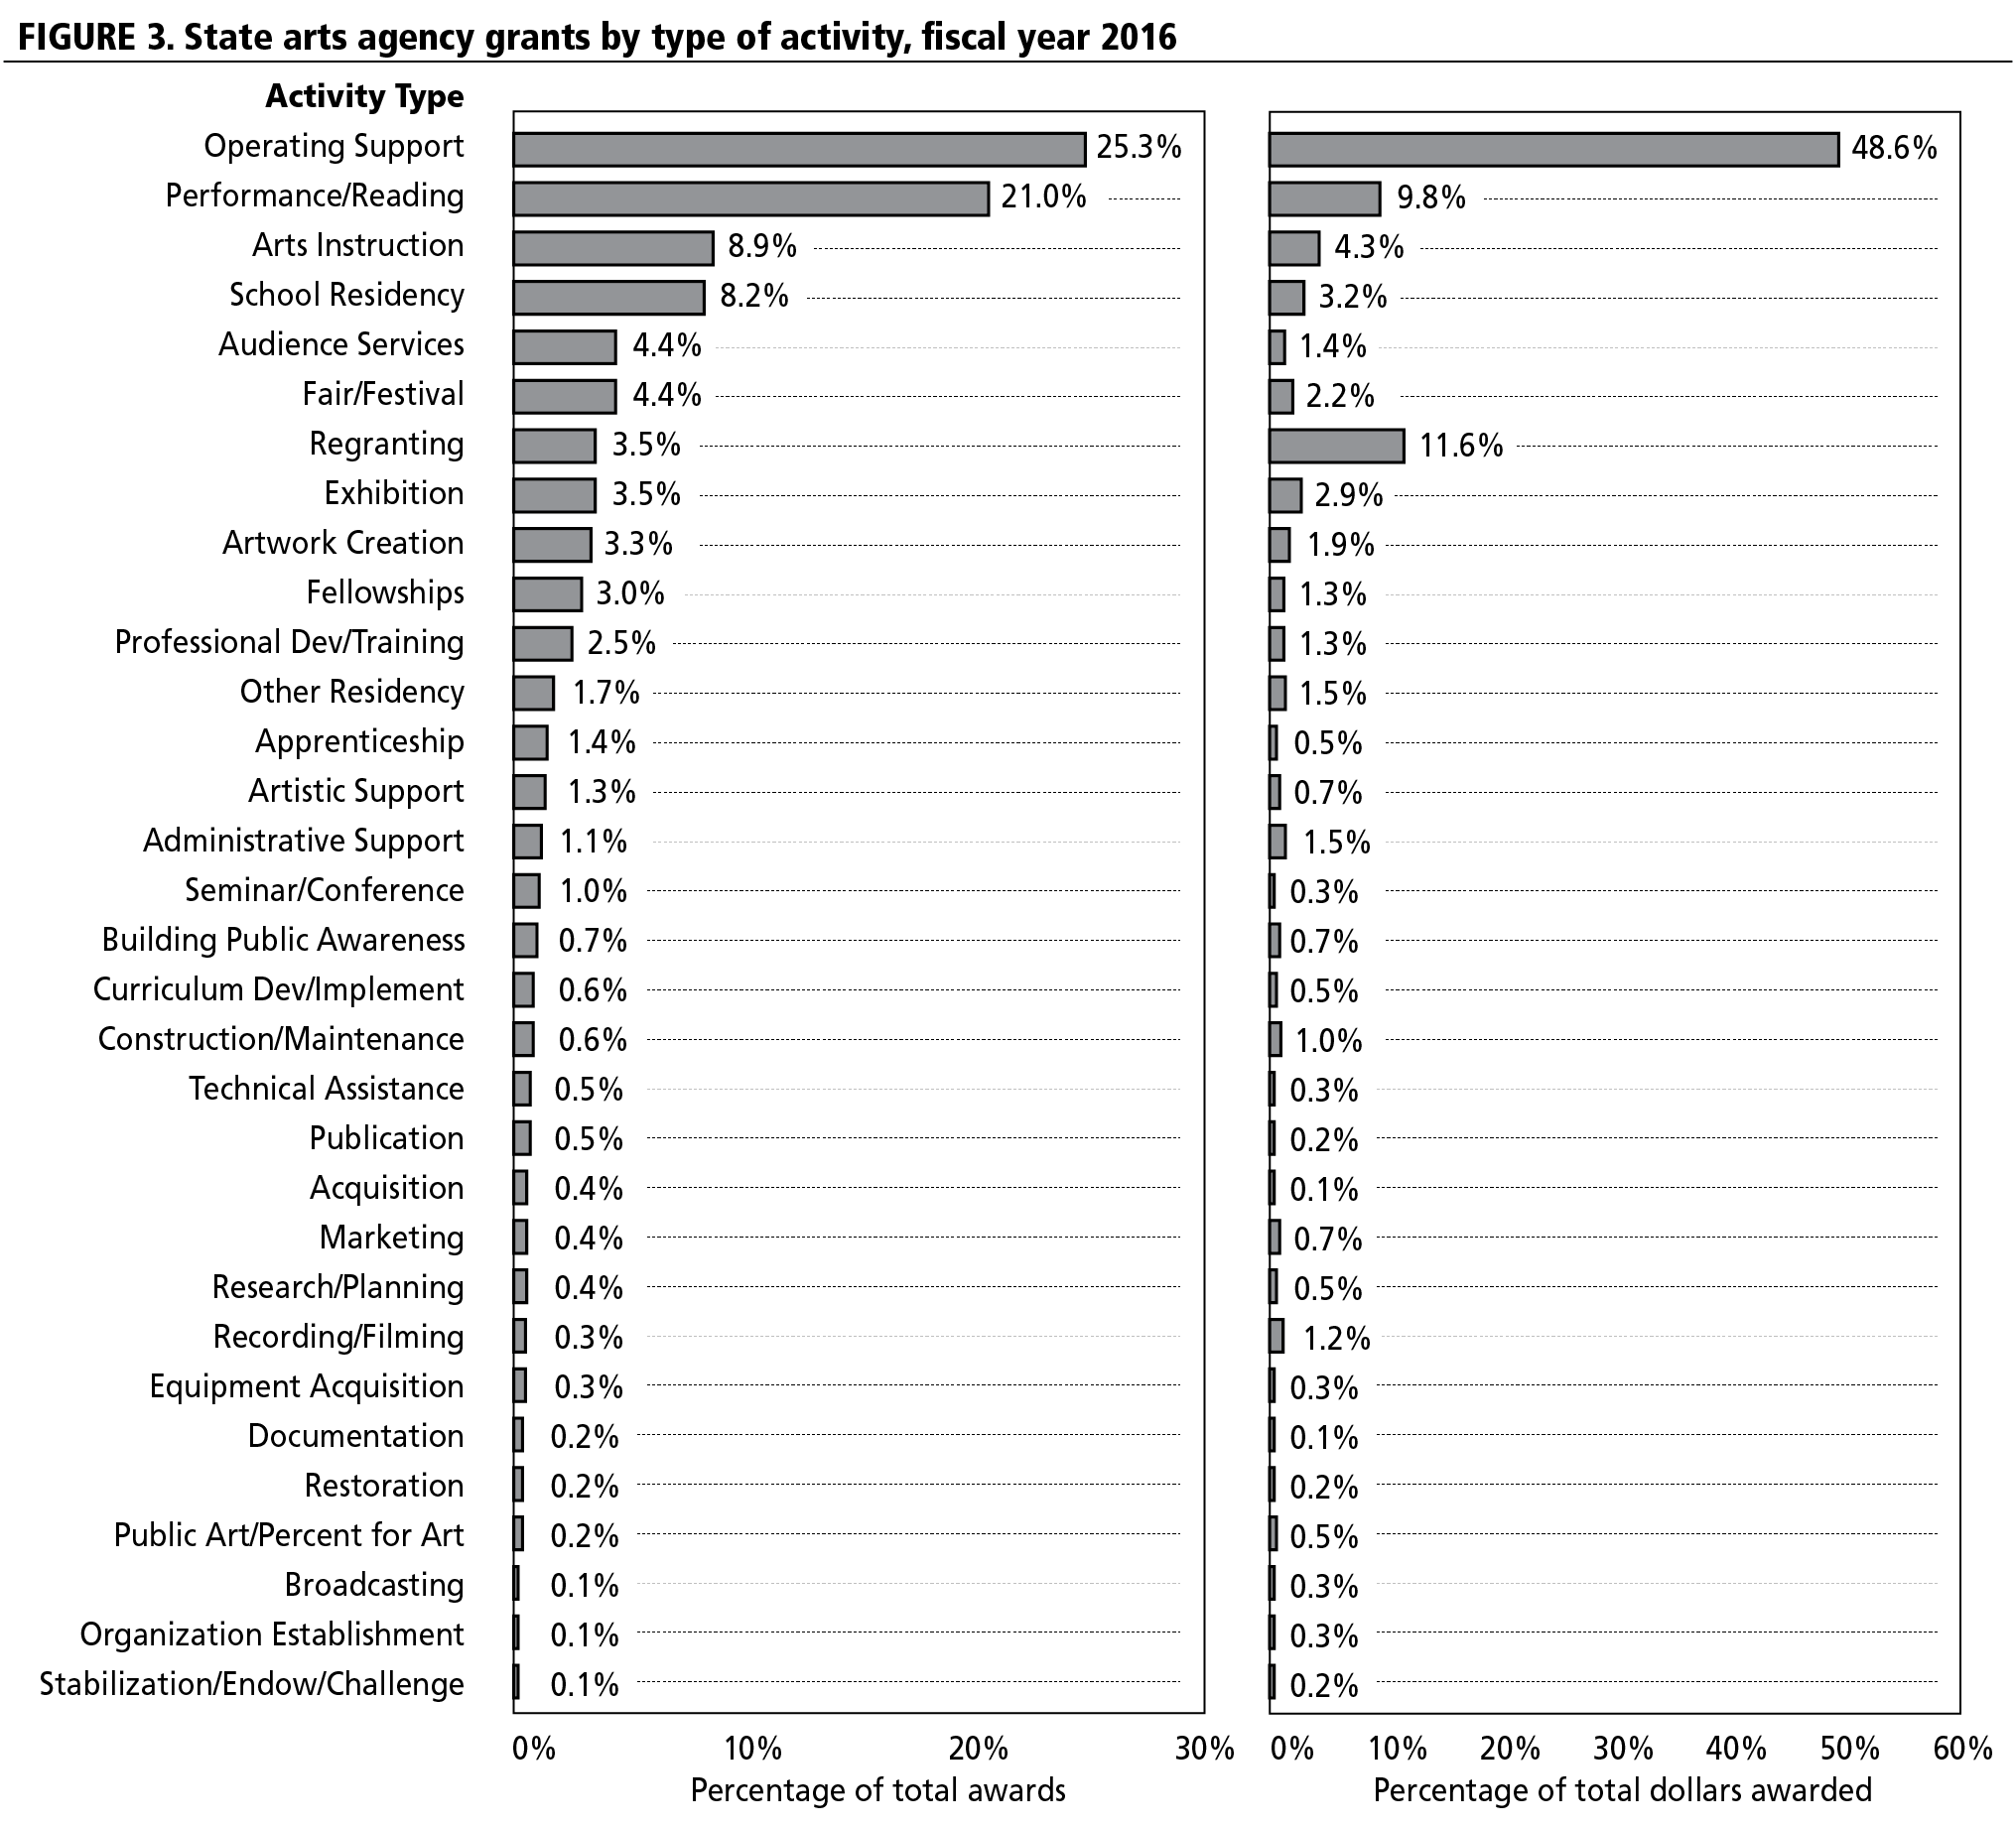
Foundations and state arts agencies make significant grant investments in operating support. Foundations spend approximately 26 percent of their grant dollars on operating support. In terms of the percentage of dollars invested, state arts agencies make the largest commitment to operational support. Forty-eight percent of state arts agency grant dollars and 25.3 percent of all state arts agency awards went to operational support in fiscal year 2016.
The NEA invests over $50 million dollars in state arts agencies and regional art organizations. These dollars are not operating support for individual arts organizations, but they help enable state arts agencies and local arts agencies to make investments in operating support.
Outside of operating support, it is possible to compare a few other grant categories and activity types. Foundations, states, and the NEA all make investments in museums, the performing arts, and arts education. A key contrast between public and private sectors is investment in capital construction and physical infrastructure. The NEA does not provide funding for capital construction, and relatively few state arts agencies make grants for facilities. Foundations bear the load for funding physical cultural infrastructure in the United States. Another challenging topic for grantmakers is investment in individual artists and fellowships.4 The NEA makes investments in individual artists through National Heritage Fellows, Jazz Masters, and Literature Fellowships. Additionally, NEA funds support state arts agencies, many of which devote large portions of their grants to individual artists.5 In fiscal year 2016, state arts agencies made 2,191 awards to individual artists. When compared to other types of applicants, awards to individual artists were the second most frequent type of award made by state arts agencies.

Grantmaking by Size of Award
The distribution patterns of government arts grants reflect another public sector objective of attaining maximum geographic coverage. Given the modest appropriations described above, this often necessitates the mechanism of awarding many grants that are small in size. An illustration of this is that state arts agencies have a median award value of $4,400. Although the median NEA award amount is $20,000, 58 percent of all NEA grants are less than $25,000 in size.
FIGURE 5. Grant distribution by size of award and grantor
| Size of award | Number of foundation grants | Number of NEA grants | Number of SAA grants |
|---|---|---|---|
| >$5 million | 43 | - | - |
| $1–$5 million | 306 | 1 | 6 |
| $500,000–$999,999 | 358 | - | 24 |
| $100,000–$499,999 | 2,599 | 39 | 223 |
| $50,000–$99,999 | 2,649 | 241 | 603 |
| $25,000–$49,999 | 3,824 | 718 | 1,202 |
| $10,000–$24,999 | 6,766 | 1,375 | 3,716 |
| Under $10,000 | N/A | 2 | 15,222 |
| Total arts grants | 18,303 | 2,376 | 20,996 |
| Median award dollar amount | $25,000 | $20,000 | $4,400 |
Sources: GIA Reader 28, No. 1 (Winter 2017); Foundation Center Sample, 2014; NEA arts.gov grants search, FY2016; excludes partnership awards to state arts agencies and regional arts organizations; SAA Final Descriptive Report records, FY2016.
Note: Foundation Center Sample excludes grants of less than $10,000.
Complementary Roles
The cultural ecosystem requires both public and private support to thrive.6 Government funds are modest but important, achieving wide geographic access to cultural experiences and embedding the arts into many functions of state government (especially education and community development). This public function is paramount in communities that lack the wealth needed to capitalize major philanthropic efforts. Private grantmakers likewise have areas of special expertise: they can take greater risks and have the ability to define their own accountability standards, whereas public funders have such standards defined by legislative bodies. Through collaboration, research, and a desire to do good, foundations often have the freedom to pursue innovative projects or to test the potential of new ideas or new practices by doing “deep work” in a smaller number of communities.
Data limitations hinder our ability to fully compare public and private grantmaking patterns. However, our analysis indicates that different segments of the arts ecosystem fill complementary roles. Observable convergences in grantmaking patterns (such as program support and arts education) reflect the high priorities that constituents ascribe to these forms of assistance. Divergences in grantmaking patterns (such as individual artist support, operating support, and facility construction) indicate that each sector is playing to its unique strengths and limitations.
To sustain and improve this balance, foundations, public agencies, and their grantees need to be effective advocates for the value of the arts in our society. Every US resident is a stakeholder in the arts, and in a representative democracy, government must be a stakeholder as well.
Ryan Stubbs, research director, National Assembly of State Arts Agencies (NASAA)
NOTES
This profile draws on local spending estimates from Americans for the Arts; National Assembly of State Arts Agencies’ legislative appropriations surveys of the nation’s state and jurisdictional arts agencies; and appropriations data from the National Endowment for the Arts. As of this writing, the most recent data available about federal and local funding for the arts are from fiscal year 2017. Fiscal year 2017 and 2018 data for state arts agencies are available from www.nasaa-arts.org. Constant dollar adjustments for inflation are calculated using Bureau of Labor Statistics Consumer Price Index (CPI) figures with a base year of 1998. Per capita calculations are based on national population estimates from the US Census Bureau.
- Americans for the Arts substantially changed the methodology for collecting local arts agency investments through the local arts agency census in 2016. Annual estimates are used prior to 2011 and after 2016.
- NASAA, State Arts Agency Grant-Making Statistics, 2017, http://www.nasaa-arts.org/Research/Grant-Making/index.php.
- NASAA, State Arts & Military Initiatives, https://nasaa-arts.org/nasaa_research/stateartsandmilitaryinitiativesstrategysampler/; Creative Forces, NEA Military Healing Network, https://www.arts.gov/partnerships/creative-forces.
- Grantmakers in the Arts, Support for Individual Artists, http://www.giarts.org/support-individual-artists.
- NASAA, State Arts Agency Support for Individual Artists Fact Sheet, https://nasaa-arts.org/nasaa_research/indivartistgrantmakingfactsheet0316/.
- Pam Breaux, “Better Together: Public and Private Funding for the Arts,” Andrew W. Mellon Foundation, https://mellon.org/resources/shared-experiences-blog/better-together-public-and-private-funding-arts/.