State of the Sector 2015: Arts and Culture Focus
Extensive research has demonstrated what those close to the arts, culture, and humanities sector already know: the health of the sector is intertwined with the health of our communities. In addition to cultural enrichment, arts, culture, and humanities nonprofits create jobs, support economic growth, and contribute to community revitalization.
In early 2015, with the support of the Doris Duke Charitable Foundation, Nonprofit Finance Fund (NFF) investigated the health of the nonprofit arts, culture, and humanities sector through its annual State of the Sector Survey. The survey findings provide greater insight into the ways that organizations are honing their programs and business models to creatively engage audiences, visitors, and supporters. Many organizations are struggling to build a business model that adapts to changing demands from audiences and the current nature of funding. Many are still grappling with longer-term capitalization challenges, like uneven cash flow, few or no reserves, and aging or underresourced facilities. As audiences age and disruptive technologies continue to proliferate, arts nonprofits must experiment with new strategies to build and engage with their audiences. But experimentation is risky, and arts organizations are frequently operating with no room for error. In the face of these real challenges, annual financial results seem to be trending positively.
The survey received 906 unique responses from arts organizations across all geographies, subsectors, and budget sizes. The results in the survey strongly reflect the experience of small and midsized organizations, with 60 percent of organizations operating with budgets under $1M. Following is an overview of key survey trends, along with our tips for grantmakers and nonprofits alike as the cultural sector continues its efforts to adapt and thrive.
Program and Financial Trends
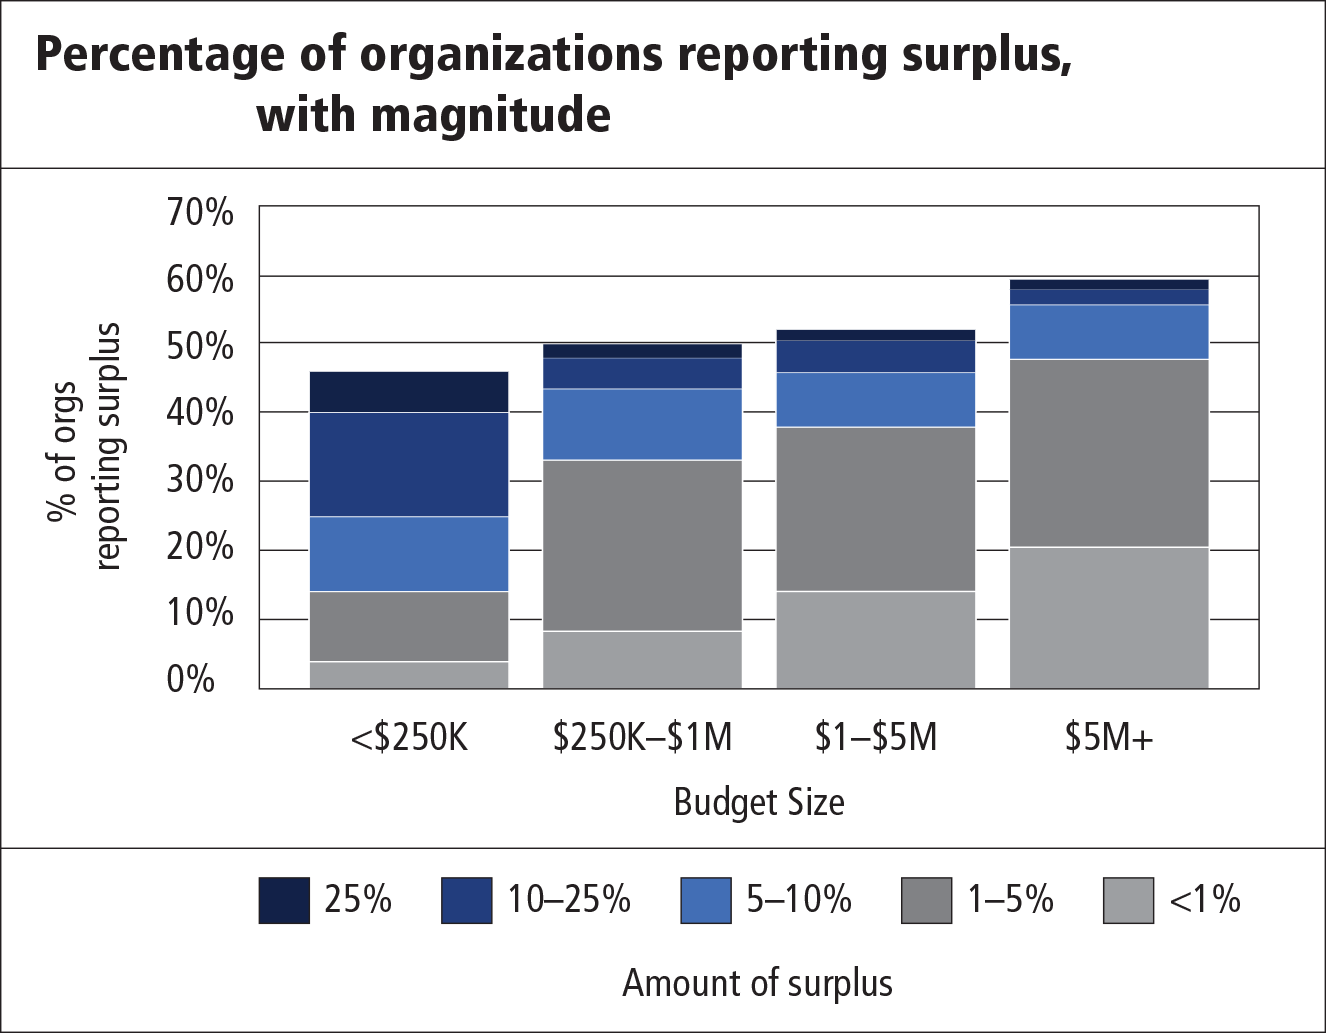
Continuing a trend that started in 2011, the percentage of arts, culture, and humanities organizations reporting deficits has declined to 24 percent. When asked about anticipated financial results for 2015, 75 percent of organizations expect to end the year at breakeven or better. While heartening, we recognize that the trend of stronger financial performance does not necessarily mean organizations are receiving the types and amounts of revenue that will truly cover the full cost of their operations. Surpluses were slim: 44 percent of organizations reported that their surplus was between 1 and 4 percent, and 20 percent of organizations reported a surplus of less than 1 percent.
Alongside upward-trending financial performance, organizations are taking action to invest in programmatic and financial health. Eighty-six percent of organizations reported making a meaningful investment to expand their audience/visitor base. Half of these organizations expanded programmatic reach through arts education programs or partnership with schools. While this is not unconventional in itself, qualitative responses indicated that the trend has been driven by the need for arts education in schools and the absence of arts educators employed directly by districts. We note that from an operating and strategic perspective, this trend most likely requires organizations to shift in a critical way. In addition to continuing to secure revenue from traditional funding structures, such as ticket sales, admission fees, or direct individual philanthropic outreach, expansion into schools often requires organizations to manage reimbursement service contracts or grants. Successfully securing and maintaining reimbursement contracts take a new kind of organizational capacity and skill set.
Organizations also report that demand extends outside of school systems, and they are fielding increased requests for collaborations. Fifty-two percent of organizations participate in formal collaborations, including work with social service/multiservice agencies to provide programs that engage diverse and new populations, enrich the cultural tapestry, and meet broader civic objectives.
Fifty-six percent of organizations reported that they added or expanded programs. One-third reported demand for and creation of programs for specific target audiences/visitor segments and/or increased participatory programming. Respondents’ qualitative answers captured a variety of tactics, including a distinct clustering of programs that target families, and programs where audiences engage directly with artists or engage in “maker” activities.
We are encouraged to see that these — and other — adjustments have allowed many organizations to access additional revenue sources and increase audiences and visitors. At the same time, we recognize that there are distinct administrative, programmatic, and reporting shifts required to implement such changes. Many organizations do not have the financial resources necessary to steward new revenue streams to a point of positive financial return.
Liquidity and Capital Needs
In 2015, 40 percent of respondents reported that achieving long-term sustainability is one of their top challenges, and 20 percent of organizations reported that raising funding that covers the full cost of services is a top three challenge.
A key indicator of a more sustainable or adaptable organization is the amount of cash that it has to weather downturns, mitigate risks, and take advantage of new opportunities. To be clear, the appropriate amount of cash will be different for every organization and depends on a number of factors. As a rough benchmark, however, nonprofits should have enough cash to sustain operations for at least three months. Having less than one month of cash at their disposal is generally considered a cash crisis. A more ideal situation is holding three to six months of cash, which makes it easier to start thinking long term and building up reserves: a rainy-day fund, facility reserves, and so on. Organizations with reserves are better prepared for an emergency — like major building repairs or loss of a primary funding source — and are more likely to continue operations uninterrupted when faced with a crisis.
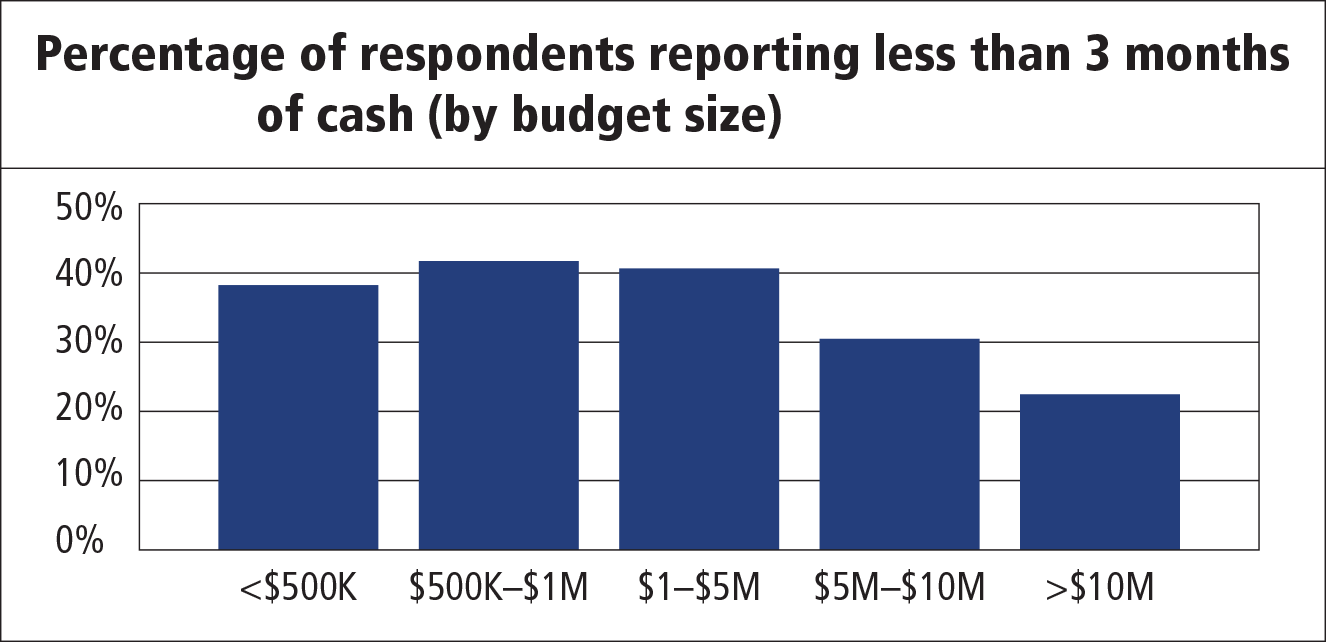
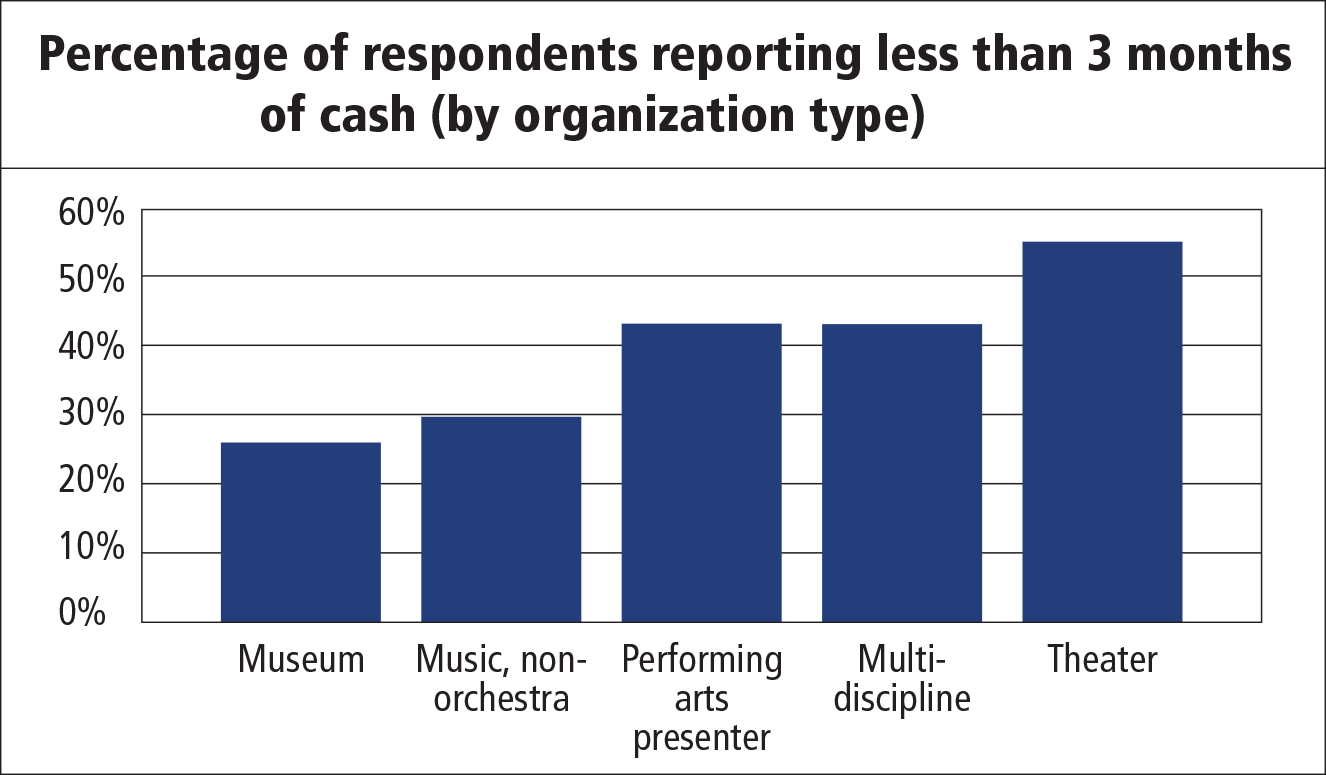
NFF asked respondents to indicate months of cash by dividing total cash by average monthly operating expenses. When reviewing months of cash for all arts and culture respondents, we found that 39 percent indicated less than three months of cash; 15 percent actually indicated less than one month. A more nuanced view emerges when viewing months of cash by budget size and sector. As depicted in the graphs, larger organizations typically have more months of cash on hand, as do museums and music (non-orchestra) organizations.
An important caveat here is that having cash does not necessarily mean that it is available for use. While the survey asks about total cash, remember that many nonprofits receive temporarily restricted funds. This means that at least some of the cash reported by our survey respondents is likely restricted. When we consider only the cash that management has readily available for use, or unrestricted liquid net assets, the reality is likely bleaker than the survey indicates.
Grantmaking Trends: The Push toward Outcomes
We note that arts, culture, and humanities funding, like the rest of the nonprofit sector, is increasingly tied to the ability to collect and interpret metrics related to performance and impact: 65 percent of organizations report that they receive at least some funding that is contingent on reaching specific outputs; and 64 percent receive funding that is contingent on outcomes. Yet, the responsibility of measurement is still a largely unfunded or underfunded mandate; 77 percent of respondents reported that funders rarely or never cover the costs of measuring program outputs or outcomes. As such, organizations are caught in an untenable position: to access additional revenue to expand or deepen programmatic offerings, they are being asked to develop the internal capacity to measure outcomes without specific up-front funding to build the necessary systems and infrastructure.
Constrained liquidity, especially when combined with deferred maintenance and facility stewardship, leaves little flexibility for management to absorb risk and even less ability to take advantage of opportunities, especially for small and midsized organizations. So how do we support our cultural organizations to successfully develop their greatest work, influence their communities, and collect the data to accurately convey their story of influence?
Recommendations for Grantmakers
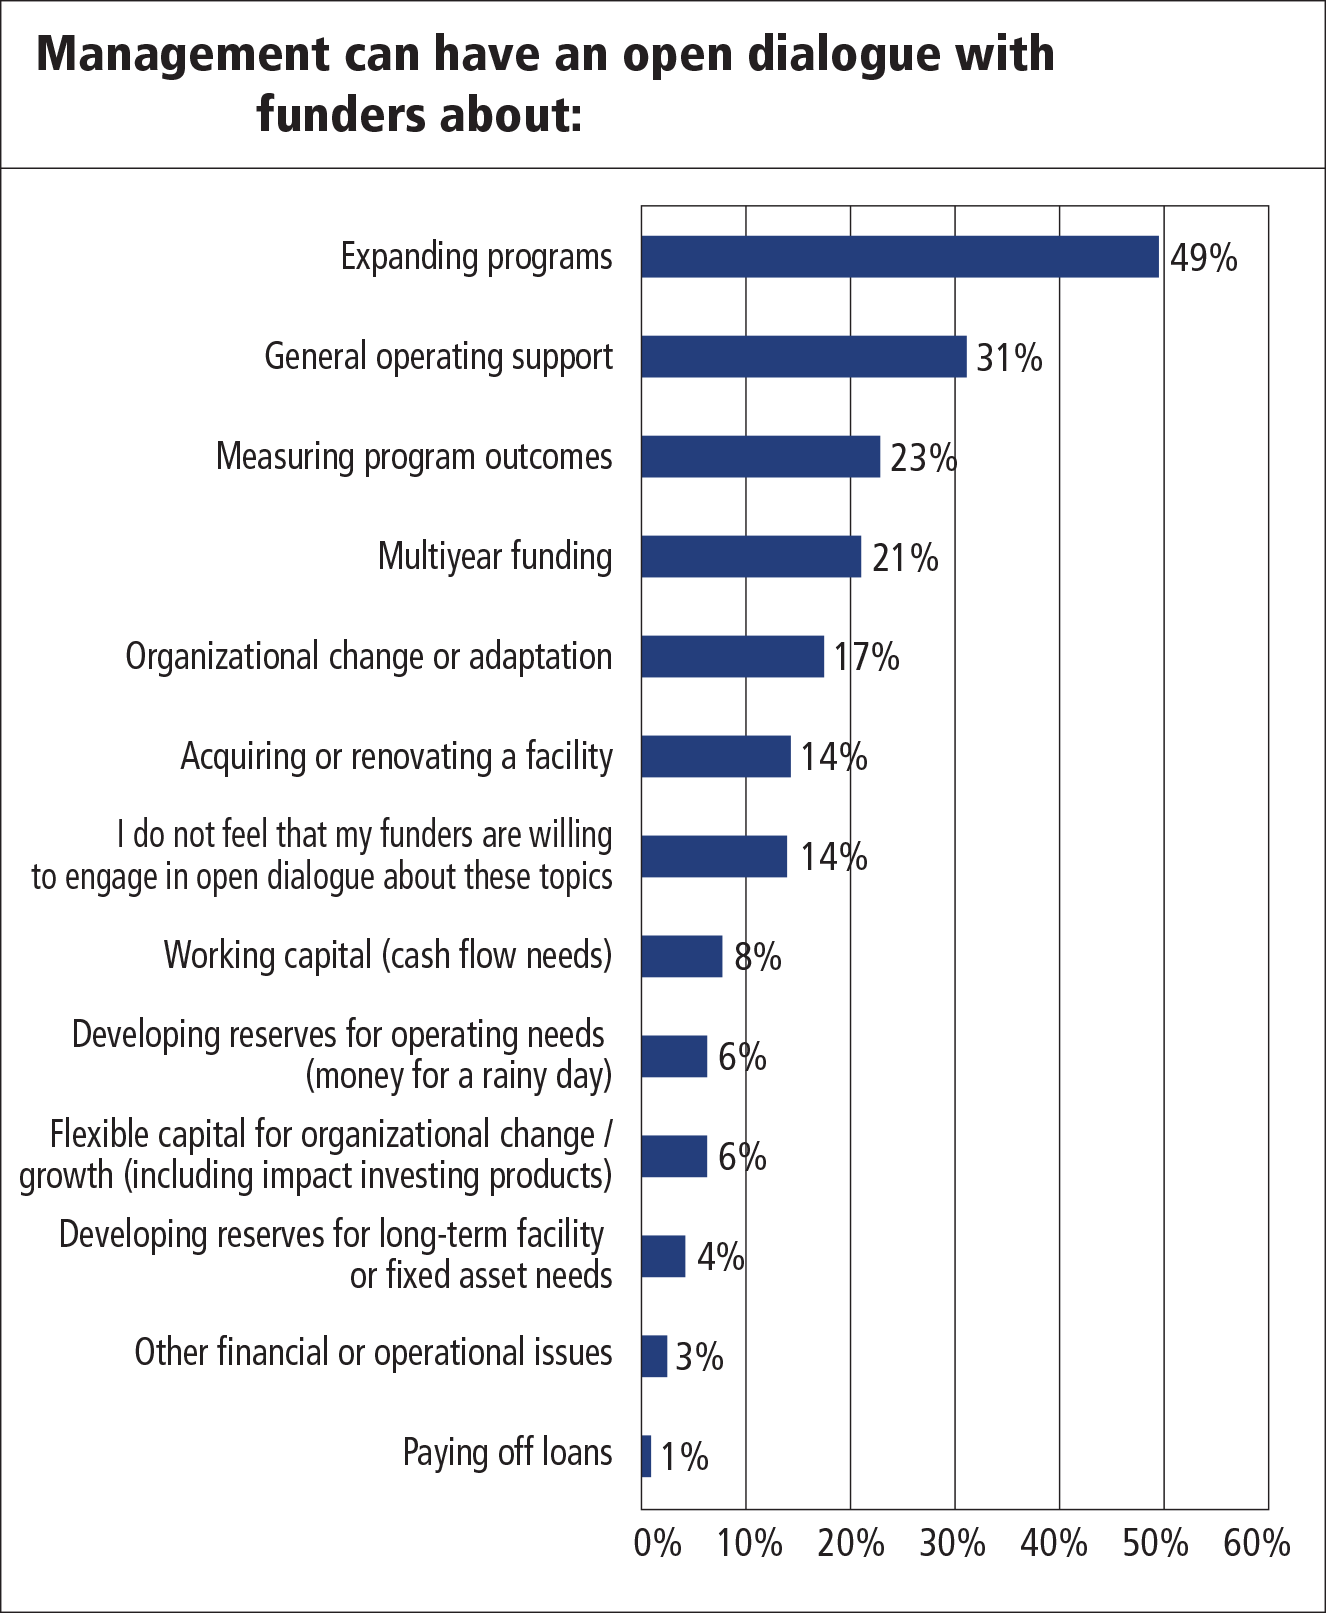
There are vast opportunities for nonprofits and funders to work together to build more adaptable organizations, meet community needs, and invest in artistic aspirations. We counsel our philanthropic partners to first remember that the majority of respondents report being “most comfortable” having an open dialogue with funders about the expansion of programs and that funder dialogue continues to emphasize program expansion over longer-term balance sheet needs, including the capital necessary to adapt and change to the environment (as depicted in the graph). With that, the recommendations below are based on the guidance that funders nurture the platform for an honest and authentic conversation with grantees about the organization’s core needs, in addition to programmatic needs:
- We encourage funders to engage in dialogue with their staff, grantees, and peer funders about deploying revenue in a way that supports — or at least is informed by — enterprise-wide financial health and capitalization principles as a means to artistic freedom.
- While not all philanthropic strategies will allow for unrestricted grants or enterprise-wide support, we advise philanthropies to inform their grantmaking by understanding the full cost of the programs they support, including the costs for the ongoing stewardship of facilities, payment of debt, cost of measurement and reporting, and the organization’s strategy for meeting balance sheet needs and capitalization goals.
- When growth or change is appropriate, funders should be realistic about the resources required to accomplish the intended goals, both in the near and longer terms.
- With the push in the wider philanthropic community to collect data and understand outcomes, we see a priority to support organizations in building the capacity to appropriately measure outcomes given the intent and nature of the program and the size of the organization. This may mean turning to more qualitative measures or working with organizations to cocreate meaningful measurement standards rather than conforming to a funder’s preexisting rubrics.
- We recommend the support of comprehensive, integrated planning that articulates artistic and organizational vision, aspirations, and strategy and is equally grounded in sound financial planning. This planning should always be rooted in the community and market dynamics in which the organization operates.
In our roles as advisors, financers, and commentators we are humbled by the resiliency and adaptability of our arts, culture, and humanities organizations. Indeed, in our own practice, the results of the survey reinforce what we see in the field. That said, there are many talented organizations that still face very real, desperate circumstances that threaten long-term viability. As we look to the years ahead, we are curious to see if and how the positive financial trend evolves, and how organizations continue to adapt, collaborate, and fund programming outside of traditional venues — all while operating in an accelerated, more measured environment.
For those interested in exploring the data more closely, full survey results are available at nff.org/survey. Interact with the data yourself using the survey analyzer! Visit survey.nff.org to investigate questions that cut across arts and culture subsectors, budget size, geography, and other dimensions.