Local Arts Agencies: Growing, Serving, Advancing
In 2015, Americans for the Arts partnered with the National Endowment for the Arts to conduct the Local Arts Agency Census, the most comprehensive survey of the local arts agency field ever conducted. Its purpose was to illuminate the ever-adapting role these organizations play in ensuring the arts have a vital presence in every community.
What Is a Local Arts Agency?
Americans for the Arts defines a local arts agency (LAA) as a private organization or an agency of local government that promotes, supports, and develops the arts at the local level. LAAs are not discipline specific. Rather, they work to sustain their entire local arts and culture industry. LAAs leverage billions of dollars in public and private funding for the arts. Some of these dollars go directly to the LAA, but many go around the LAA and directly to arts and cultural organizations. Each LAA is unique to the community that it serves, and each evolves with its community. No two LAAs are exactly alike. What they all share, however, is the goal of enabling diverse forms of arts and culture to thrive — ensuring greater accessibility and healthier communities through the arts.
A Local Arts Agency by Any Other Name…
While its work may be similar to an LAA, a “local arts agency” does not always go by that name. Organizational names may include words such as arts, culture, heritage, humanities, science, creative economy, agency, or council.
Since 1960, the number of LAAs in the United States has grown more than tenfold, from 400 to 4,500. The greatest rate of growth was during the 1970s and 1980s. LAAs are now found in every state and serve populations that range from small and rural to large and urban. Some LAAs depend entirely on volunteers, while others have large budgets, as much as $156 million for the LAA with the largest budget in the country. Nationally, 70 percent are private nonprofit organizations, and 30 percent are agencies of a city or county government.
Some communities have multiple LAAs that work to meet different needs for their constituents. The people of Philadelphia, for example, are served by three: Greater Philadelphia Cultural Alliance (nonprofit organization); Arts & Business Council of Greater Philadelphia (an affiliate of the Chamber of Commerce); and City of Philadelphia Office of Arts, Culture and the Creative Economy (a city agency).
The Local Arts Agency Census
The LAA Census was designed by a task force of local arts agency, research, and policy experts to ensure both relevance and rigor. The survey was sent to the 4,377 LAAs in the United States known to Americans for the Arts. Of that number, 1,127, or 26 percent, responded. Large- and midsized LAAs responded at a very high rate, while small and volunteer-driven LAAs were underrepresented in the survey respondents.
Local Arts Agency Budgets
Aggregate revenues for all 1,127 of the responding LAAs totaled $1.375 billion in 2015, and their total expenses were $1.301 billion. Local government funding to these LAAs was $738 million in 2015. This was the fourth consecutive year of growth in their total budgets and local government support (see figure 1).
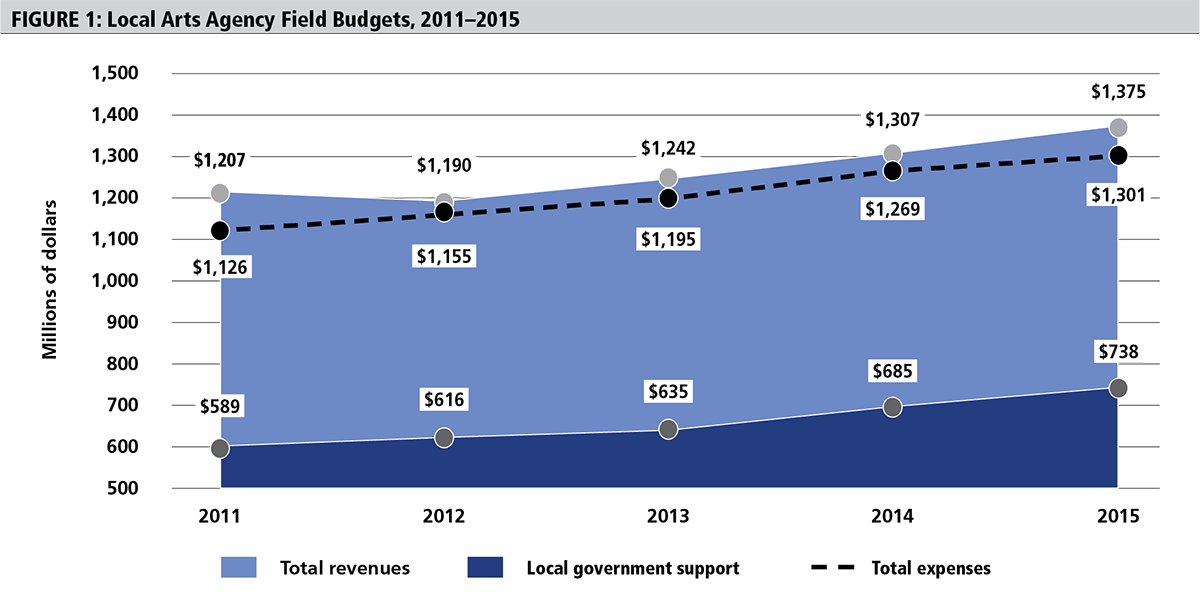
In addition the survey found the following:
- In their most recent fiscal year, 48 percent of LAAs finished with a surplus, and 31 percent with a break-even budget. Just one in five (21 percent) reported more expenses than revenues.
- Between 2014 and 2015, 67 percent of LAAs had level or increased budgets.
- In 2015, arts funding from local government sources (city and/or county) grew for the fourth consecutive year to $738 million.
Sources of Revenue
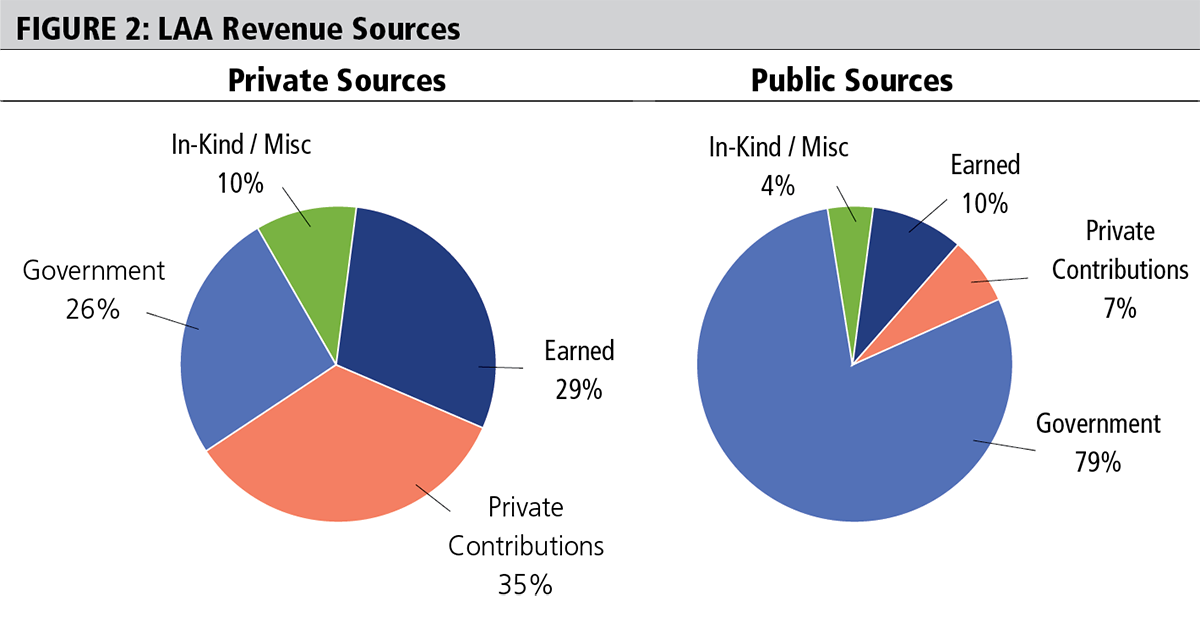
There has always been significant variation in revenue sources depending on whether an LAA is public or private. As the survey results show (see figure 2), private nonprofit LAAs typically include a mixture of donations from individuals and businesses, foundation support, earned-income activities, and grants or service contracts from government. Public LAAs’ largest source of revenue is typically from local government with a small percentage coming from earned income and private contributions.
Local Option Taxes: “The Gift That Keeps on Giving”
LAAs are instrumental in the establishment of local option taxes — designated tax revenue streams that are used to fund arts and culture locally. They provide significant and long-term funding for the arts community. Examples include St. Louis’s property tax ($70 million per year), San Francisco’s hotel tax ($30 million per year), Denver’s sales tax ($45 million per year), and Cuyahoga County’s cigarette tax ($15 million per year). Sixteen percent of LAAs indicated they receive funds from a local option tax; public agencies receive them more frequently than private agencies (20 percent versus 14 percent). The most common of these is by far the lodging tax (66 percent), followed by percent-for-art programs that finance public art (32 percent), and sales taxes (11 percent).
Expenditures
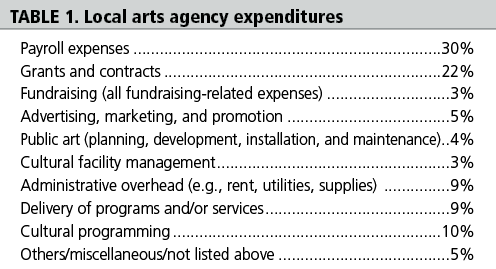
Total expenditures for the 1,127 surveyed LAAs were approximately $1.3 billion in 2015. After payroll, the largest single expense for LAAs is grantmaking (22 percent of expenditures on average) (see table 1).
Programs and Services Provided by LAAs
The following seven programs and services were provided by varying percentages of the LAAs surveyed:
- Policy and advocacy: 95 percent champion policies and funding for broader and more equitable access to the arts.
- Partnerships: 92 percent collaborate with a community agency or organization; 76 percent have three or more ongoing collaborations.
- Grantmaking: 53 percent provide direct community investment in local artists and/or arts organizations.
- Facility management: 59 percent manage cultural facilities, such as performance and exhibition spaces and arts incubators.
- Cultural programming: 78 percent engage their community in the arts through direct programming, such as public art, hands-on arts centers, and festivals.
- Arts services: 95 percent enable vibrant arts communities through services such as marketing, visibility, volunteer recruitment, and online arts calendars.
- Arts education: 89 percent deliver arts education programs and activities in the schools and community-wide.
Grantmaking
Fifty-three percent of LAAs provide financial support to arts organizations and/or individual artists in the form of grants and contracts. Of these LAAs, 49 percent provide financial support to nonprofit arts organizations; 35 percent provide financial support to individual artists; and 30 percent support both arts organizations and artists.
On average, public LAAs that are grantmakers allocate 47 percent of their total budget to grantmaking, while private LAAs allocate 28 percent. LAAs provide funds to both emerging and established organizations for general operating support (49 percent) and cultural programming (92 percent). Funding for individual artists may include special projects (42 percent), professional development (32 percent), and fellowships (12 percent). The census also found the following:
- 97 percent of LAA grant dollars go to organizations, and just 3 percent to individuals.
- LAAs awarded 64 percent of the dollars requested by organizations ($266.3 million out of $413.4 million), and 20 percent of the dollars requested by individuals ($7.8 million out of $38.7 million).
- Three-quarters of organizations that apply for grants receive at least some funding, compared to one-third of individuals applying.
- For organizations, the median smallest grant was $650, and the median largest grant was ten times higher, at $6,550. The median smallest grant given by an LAA to an individual was $500, while the median largest grant was three times as big, at $1,607.
Diversity and Equity
Local arts agencies use the arts to build bridges between cultures and connect communities. Sixty-one percent of LAAs increase the diversity of the arts organizations and individuals they serve through their programs, funding, and partnerships. One-third of LAAs (35 percent) felt they “have an appropriate level of diversity” in their organization. Thirty-nine percent have written diversity policies for staff, and 29 percent have policies for their boards. Not surprisingly, board and staff at LAAs with written diversity policies are less likely to be all white (27 percent for boards, 39 percent for staff), compared to agencies with no written policies (45 percent for boards, 58 percent for staff).
The census showed that local arts agencies are working toward a more equitable grantmaking field:
- 42 percent of grantmaking LAAs have funding programs that require the grantee to demonstrate diversity in a specific area, most commonly the audience (29 percent) but also in other aspects, such as artists involved in the project (17 percent).
- 78 percent consider diversity when selecting panelists for the grant review process (66 percent, informally, and 12 percent according to written guidelines).
- 71 percent ask that panels take diversity into account when making funding decisions (50 percent, informally, and 22 percent through a written policy).
- 14 percent have written guidelines about consideration of diversity of artistic disciplines.
LAAs also have formalized guidelines or policies for diversity when making decisions about programming, services, and/or awarding financial support (33 percent). These guidelines are most commonly related to disability and race (22 and 21 percent, respectively), but also age (16 percent), gender (15 percent), sexual orientation (14 percent), and income (12 percent), among other characteristics, such as educational attainment.
Community and Cultural Planning
Twenty-eight percent of LAAs report that they have participated in cultural planning — a community-inclusive process of assessing the cultural needs of the community and mapping an implementation plan. Interestingly, in communities with a cultural plan, LAA budgets and their support from local government both increased at a greater rate than in communities with no cultural plan. This is a finding observed in LAA surveys since the 1990s.
LAAs also ensure that the arts are part of broader civic planning efforts. Thirty-eight percent indicate that arts and culture has been integrated into an adopted community-wide comprehensive planning effort. Of those, the arts have been incorporated into, for example, economic development plans (62 percent) and tourism planning efforts (47 percent). Others include way-finding, land-use, business development, transportation, housing, and environmental plans.
Partnerships and Collaborations
LAAs are community connectors. Ninety-two percent maintain at least one partnership with a community agency or organization, and 76 percent have three or more ongoing collaborations.
More than half of LAAs partner with a chamber of commerce, library, convention and visitors bureau, parks and recreation department, or school district. These partnerships provide new opportunities for artists and arts organizations, help collaborators advance their missions by using the arts, and create arts experiences for the public in both arts and non-arts venues across the community.
Because partnership and collaboration can mean different things to different people, respondents were asked about the actual work involved between the organizations. A range of five categories of partnership were offered. Not surprisingly, informal relationships are more common than the deeper and more rigorous ones:
- 79 percent have “informal conversations” with partner organizations.
- 65 percent “meet regularly” with partners.
- 75 percent “work together to plan, fund, and implement programs.”
- 31 percent fund a partner “through grants or contracts.”
- 46 percent have a partner that has fully “integrated the arts into their initiatives.”
Arts and Community Development Programs
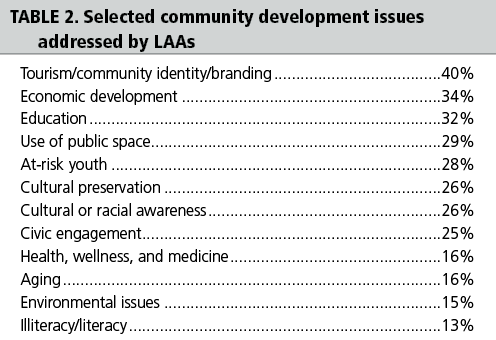
Over half of LAAs (57 percent) are involved in using the arts to address community development issues ranging from youth at risk, homelessness, and illiteracy to the creative economy, cultural districts, and civic engagement (see table 2). Forty-nine percent are directly involved in addressing community development issues through their own arts programming. Twenty-eight percent are indirectly involved by addressing key local issues through grants or contracts awarded to artists or arts organizations in their community.
Advocacy and Strategic Messaging
Effective advocacy means billions of dollars directed to artists and arts organizations, more equitable access to the arts, and new pathways to arts engagement for the community. Ninety-five percent of LAAs make the case for arts funding and arts policies to private and public sector leaders and donors. LAAs advocate for issues ranging from increased arts funding and cultural tourism to arts education and public art in their communities.
Respondents were asked to rank the effectiveness of twenty-six case-making arguments. The top three were arts education, the economic impact of the arts, and improving quality of life. Local arts agency leaders find different messages are more effective with different types of funders or leaders. As the effective arts advocate knows, however, different messages often resonate the loudest to different constituencies. Notice how the top three messages differ for the four funder categories:
- private funders:
- arts education
- improving quality of life
- community livability
- elected officials:
- economic impact
- arts and community development
- arts education
- individual donors:
- arts education
- quality of life
- “arts for arts’ sake”
- business leaders:
- economic impact
- benefits to business
- arts and community development
Arts Education Programs
Eighty-nine percent of LAAs are involved in arts education programs and in-school and/or out-of-school activities. Common strategies that LAAs use to support arts education include residencies or performances, directories of artists and arts organizations, and advocating on behalf of arts education. The census also found the following:
- 73 percent include addressing arts education in their community as part of the agency’s written mission statement and/or goals.
- 47 percent receive revenue that is dedicated specifically to support arts education efforts.
- On average, 19 percent of the LAA operating budget is designated toward arts education.
- 70 percent provide staffing for their arts education–related activities. They do so most frequently by working with arts education practitioners such as educators and teaching artists (55 percent) and with volunteers (45 percent).
The Local Arts Agency Census was a (really!) long survey. We are grateful to the 1,127 LAAs that responded. This article highlights just a portion of the findings. You can read more at www.AmericansForTheArts.org/LocalArtsAgencyCensus.