Foundation Grants to Arts and Culture, 2013
A One-Year Snapshot
Beginning with this snapshot of arts funding, Foundation Center’s annual analyses of foundation arts and culture grantmaking will be based on our new Philanthropy Classification System. This system of coding and organizing foundation funding replaces the Grants Classification System, which was employed by Foundation Center for nearly a quarter century. It reflects an evolution in the way that giving for the arts and other fields is captured and represented. Most areas of funding focus remain consistent across the two systems, while new codes have been added for specific areas of activity such as public arts, printmaking, and spoken word. At the same time, funding for media and communication has been relocated out of the arts and into its own separate area of the new taxonomy — a logical and long overdue reorganization of the system. In our previous Grants Classification System, which was designed to be consistent with the National Taxonomy of Exempt Entities (NTEE), media and communications grants were included with arts and culture grants. However, the vast majority of these grants did not have a direct relationship to the arts, culture, or humanities. As a result, overall funding for arts and culture will appear to account for a notably smaller share of total grant dollars than in prior years. The new Philanthropy Classification System also includes an expanded and reorganized representation of the types of support being provided by foundations. Readers of this analysis will continue to find comparisons of funding for the main priorities of general, capital, and program support, while now also being able to find the shares of funding supporting arts policy and capacity building, among other strategies. While adjusting to these representations may present some initial challenges, the new system ultimately offers grantmakers a much more nuanced picture of their funding priorities.
In 2013, giving by the approximately 87,000 active US foundations rose nearly 7 percent, to $55.3 billion. Among 1,000 of the largest US independent, corporate, community, and grantmaking operating foundations included in Foundation Center’s 2013 FC 1000 data set, however, arts and culture funding grew at a more modest rate, which also did not keep pace with the rise in overall foundation giving in the sample. In addition, while actual grant dollars in 2013 were higher and the field continued to rank among the top three foundation funding priorities, the share of overall foundation support targeting arts and culture remained at a lower share than was reported in the 1980s, 1990s, and even earlier in the 2000s. With the economic recovery in full effect by 2013 and no notable rise in the share of funding targeting the arts, there is no current trend that suggests the arts will regain a larger share of total foundation funding in the foreseeable future.
Highlights
Foundation Center offers these key findings from GIA’s fourteenth snapshot of foundation giving to arts and culture. As noted above, the definition of arts and culture used for this snapshot is based on Foundation Center’s new Philanthropy Classification System and encompasses funding for the performing arts, museums, visual arts, multidisciplinary arts, humanities, historical activities, arts services, folk arts, public arts, and cultural awareness. 1 The findings tell us about the changes in foundation giving for the arts between 2012 and 2013 and the distribution of 2013 arts and culture giving by 1,000 of the largest US foundations by total giving. They are based on all arts grants of $10,000 or more reported to Foundation Center by these sets of the largest US foundations, hereafter referred to as “the sample.” 2 The center has conducted annual examinations of the giving patterns of the nation’s largest foundations for close to four decades.
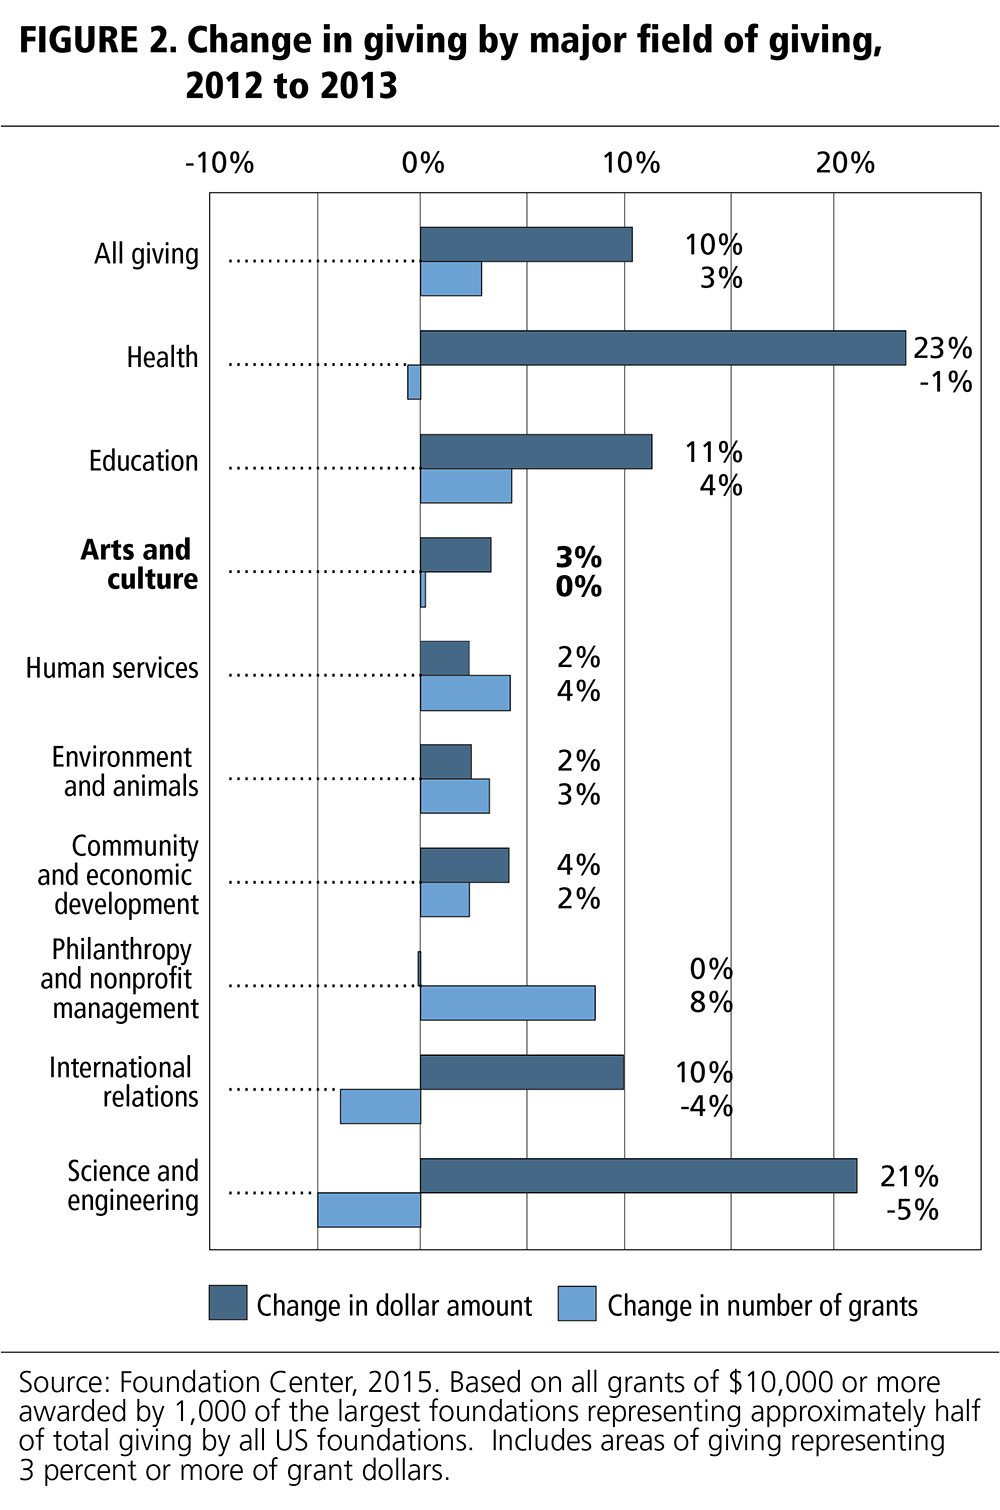
Foundation funding for arts and culture increased in 2013. Among 1,000 of the largest US independent, corporate, community, and grantmaking operating foundations included in Foundation Center’s 2013 FC 1000 data set, arts funding was up 3.3 percent between 2012 and 2013 but lagged well behind a 10 percent increase in overall giving by these foundations.
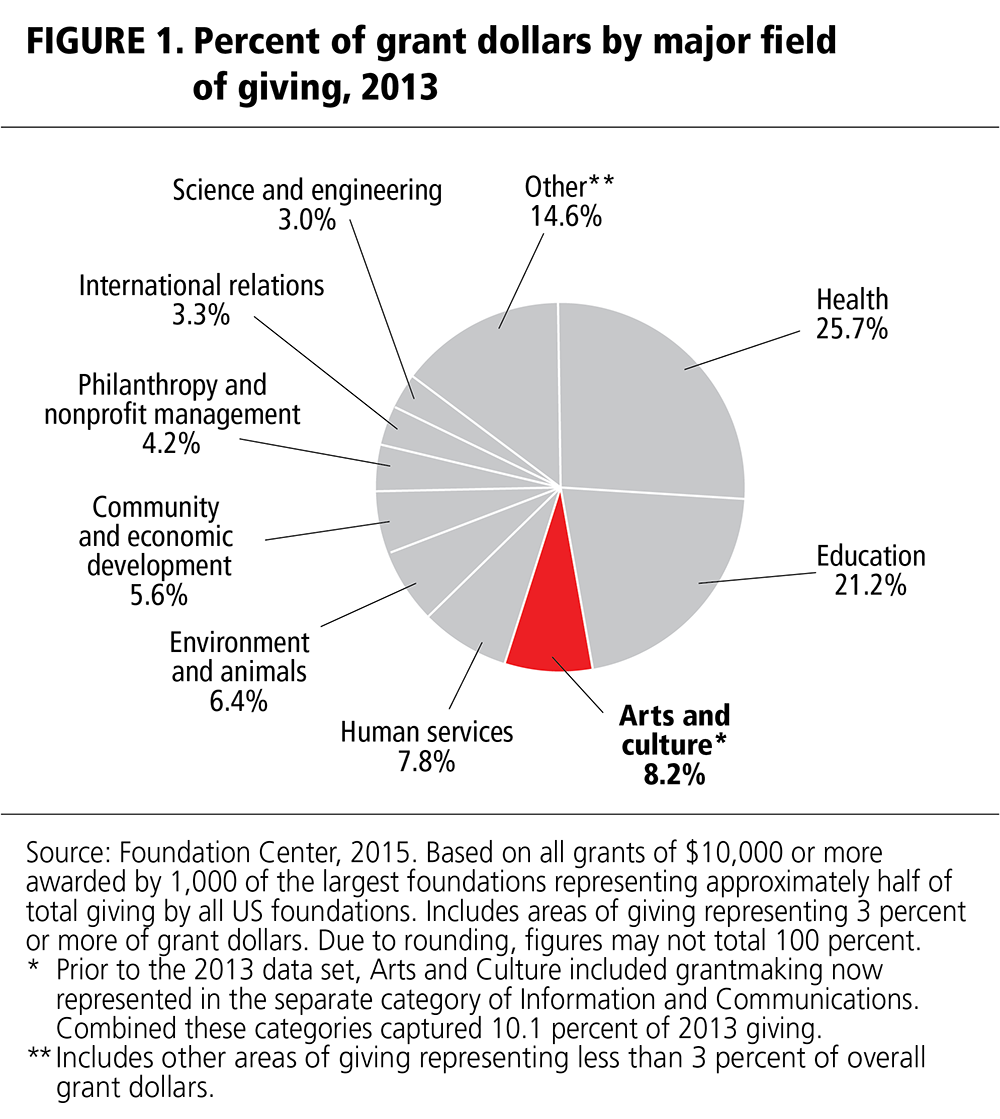
Arts funding as a share of total dollars dipped slightly in 2013. Among the 1,000 largest foundations included in Foundation Center’s grants sample for 2013, arts giving totaled $2 billion, or 8.2 percent of overall grant dollars. If media and communications were still included as a subcategory, arts and culture would have captured 10.1 percent of grant dollars. By share of number of grants, arts captured 11.6 percent of grants (or 13.8 percent if media and communications were included). Compared to the previous year, share of dollars was down slightly while share of number of arts grants remained basically unchanged.
The size of the median arts grant remained unchanged. The median arts and culture grant size — $25,000 — did not change from 2012 to 2013, although the real value of the median grant decreased due to inflation. The unadjusted value was below the $30,000 median amount for all foundation grants in the latest year.
Large grants account for more than half of arts grant dollars. Large arts grants of $500,000 and more captured 54.6 percent of total grant dollars for the arts in the 2013 sample, up slightly from 52.2 percent in 2012.
Relative to most other fields, a larger share of arts grant dollars provided operating support. In 2013, general operating support accounted for 26.7 percent of arts and culture grant dollars. By comparison, just 13 percent of arts grant dollars in 1989 provided operating support.
Top arts funders accounted for a larger share of overall giving. The top 25 arts funders by giving amount provided 33.1 percent of total foundation arts dollars in 2013, roughly consistent with 33.7 percent in 2012. The share of arts giving accounted for by the top funders remains well below the more than 50 percent shares recorded in the early 1980s.
Please note: It is important to keep in mind that the foundation grantmaking examined here represents only one source of arts financing. It does not examine arts support from earned income, governments, individual donors, or the business community. This analysis also looks only at foundation arts support for nonprofit organizations, and not for individual artists, commercial arts enterprises, or informal and unincorporated activities.
Specific Findings
Overall foundation dollars for the arts. The 1,000 largest foundations by total giving included in Foundation Center’s 2013 sample awarded 18,305 arts and culture grants totaling $2 billion, or 8.2 percent of overall grant dollars (figure 1). With the transition to the new Philanthropy Classification System, media and communications are no longer a subcategory of arts and culture. If media and communications were still included as a subcategory, arts and culture would have captured 10.1 percent of grant dollars. By share of number of grants, arts captured 11.6 percent of grants in 2013 (or 13.8 percent if media and communications were included). Compared to the previous year, share of dollars was down slightly, while share of number of arts grants remained basically unchanged. Between 2012 and 2013, giving for the arts increased 3 percent, compared to a 10 percent increase in grant dollars overall. Among the eight top-ranked subject areas by grant dollars, all areas reported an increase, led by health, science and engineering, and education (figure 2).
The impact of exceptionally large grants. Every year and in all funding areas, a few very large grants can skew overall totals, creating distortions in long-term grantmaking trends. In 2013, seven arts and culture grants provided at least $10 million, and instances where these grants had a notable impact on grantmaking patterns are identified throughout this analysis. Yet despite the potential fluctuations caused by these exceptional grants, Foundation Center data in all fields have always included them, providing consistency over time. (In addition, Foundation Center provides statistics based on share of number of grants, which are not skewed by exceptionally large grants.)
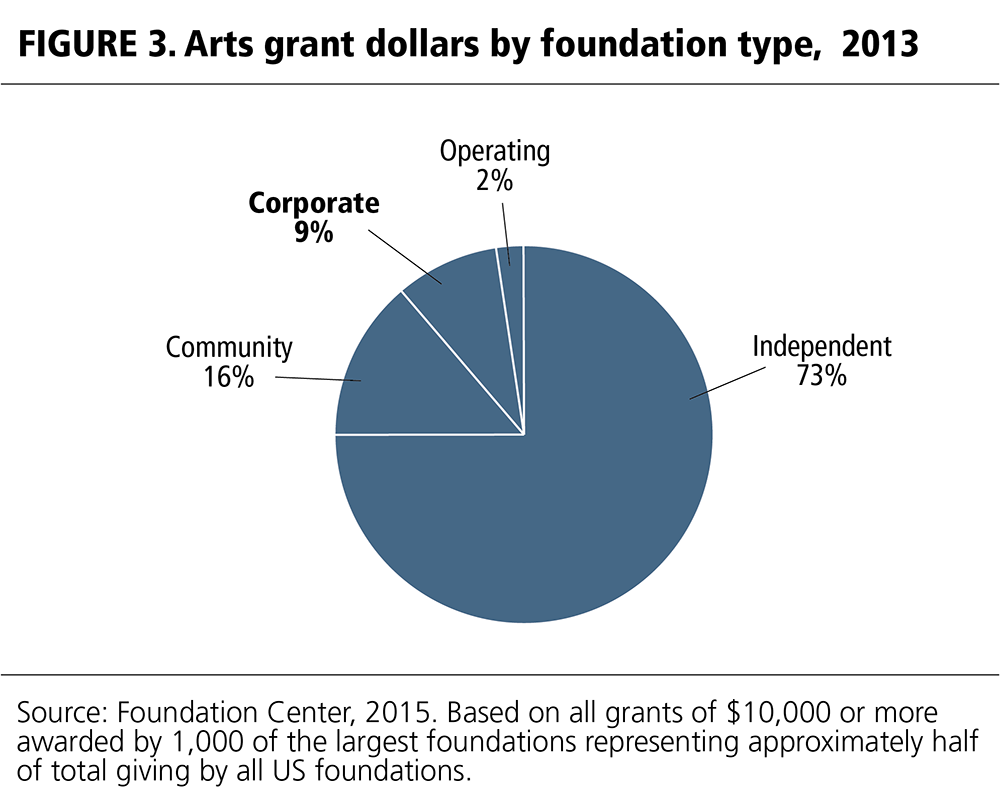
Corporate foundations represent an important source of support for arts and culture. While corporate foundations account for less than 4 percent of US private and community foundations, the larger corporate foundations included in the 2013 grants sample provided 9 percent of grant dollars for the arts (figure 3). Actual grant dollars totaled $181.6 million. By number, corporate foundations allocated 3,083 grants, or 17 percent, of the overall number of arts grants in 2013.
Grants by Arts Subfield
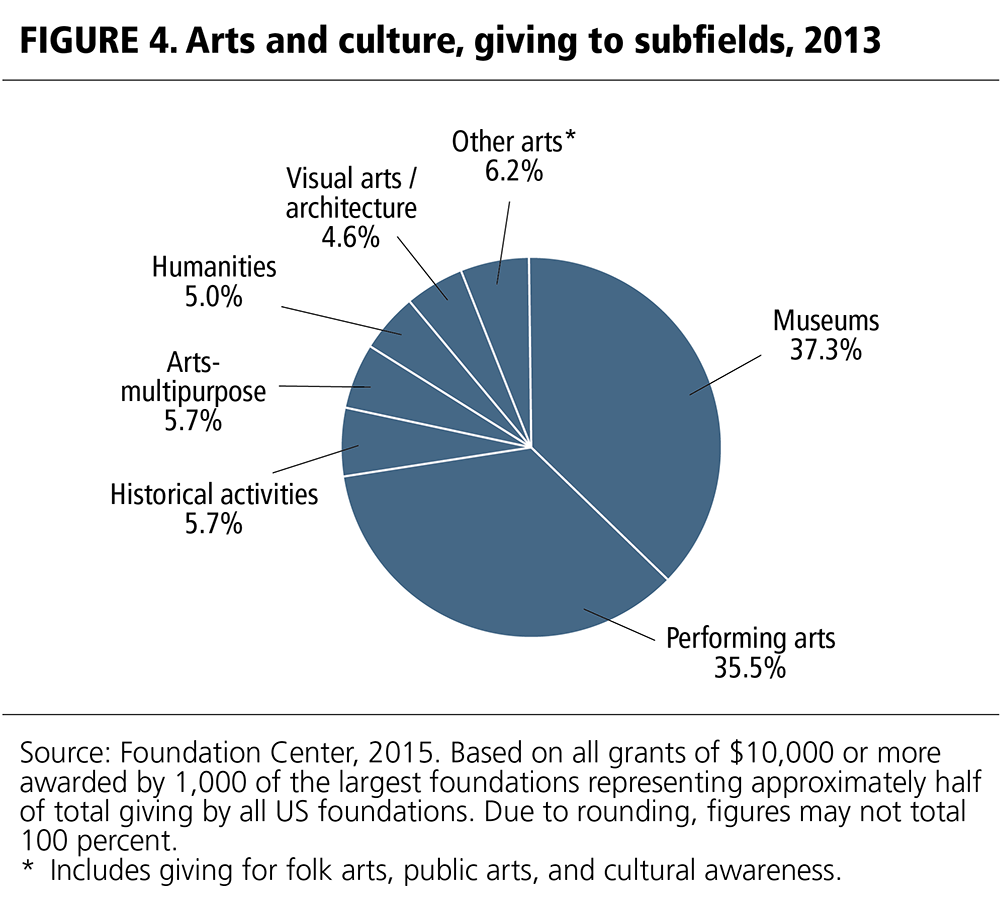
Funding for museums accounted for close to two-fifths (37.3 percent) of all foundation art dollars in 2013 (figure 4), surpassing the share reported for the performing arts (35.5 percent). From the start of the 1980s until 1997, the performing arts consistently received more foundation support than museums. However, museums surpassed the performing arts by share in the late 1990s to early 2000s and several times in recent years (2008, 2009, and 2013). More study would be needed to adequately understand the underlying reasons for the shifts in share between these two fields of activity, for example, the entry onto the scene of new and large arts funders, extraordinarily large grants, the contribution of valuable art collections, and new capital projects at museums.
Giving to museums. In 2013, museums benefited from 4,256 grants totaling nearly $750 million awarded by the 1,000 larger foundations included in the grants set. Among museum types, more than half of funding supported art museums. Grant dollars allocated to museums increased 10.8 percent between 2012 and 2013, while the number of grants awarded was down about 1 percent. The largest museum grant in 2013 was a $29.3 million award from the Hall Family Foundation to the Nelson Gallery Foundation.
Giving to performing arts. In 2013, performing arts grant dollars declined 1.5 percent, while the number of grants rose 1.3 percent. A total of 8,382 grants were awarded for the performing arts by foundations in the set — close to double the number reported for museums. In general, the average performing arts grant tends to be smaller in size than the average museum grant. The largest share of giving to the performing arts supported theaters and performing arts centers. One of the biggest performing arts grants in the latest sample was a $4.1 million award from the New York–based Doris Duke Charitable Foundation to the Creative Capital Foundation for the Multi-Arts Production Fund (MAP Fund). The organization supports innovation and cross-cultural exploration in new works of live performance. Included within the performing arts is support for performing arts education, which totaled $37.4 million in 2013. (See “Giving to multidisciplinary arts” below for a figure on foundation grant dollars supporting other types of arts education.)
Giving to historic preservation. Support for historic preservation declined 3.4 percent between 2012 and 2013. 3 The number of grants awarded was also down 4.3 percent. Overall, historic preservation benefited from 1,236 grants totaling $115.4 million in 2013.
Giving to the humanities. Funding for the humanities accounted for 5 percent of arts grant dollars in 2013, up slightly from the 4.7 percent share captured in 2012. Grant dollars awarded for the humanities increased 11.6 percent, while the number of grants awarded held steady. Included within the humanities is funding for art history, history and archaeology, classical and foreign languages, linguistics, literature, philosophy, and theology.
Giving to multidisciplinary arts. The share of arts giving for multidisciplinary arts fell to 6 percent in 2013. 4 Grant dollars awarded for multidisciplinary arts also declined 12 percent between 2012 and 2013. Among the various subcategories of multidisciplinary arts, arts education (excluding performing arts education) totaled $61.7 million in the latest year.
Giving to the visual arts. Grant dollars for the visual arts and architecture jumped 14.3 percent between 2012 and 2013, although the number of grants for the field declined 4.6 percent. The visual arts and architecture benefited from $92.7 million in 2013, including $4.2 million in operating support from The Brown Foundation to The Menil Collection for the exhibitions Nice. Luc Tuymans and Lee Bontecou: Drawn Worlds.
Grants by Support Strategy 5
An important caveat to report on the allocation of foundation dollars by specific support strategy is that for roughly 12 percent of arts grant dollars in the 2013 Foundation Center sample, the support strategy could not be identified. This means that modest differences in percentages — that is, variations under 10 percent — may not be reliable. (The grant records available to Foundation Center often lack the information necessary to identify the support strategy. For example, it is often the case that the only source of data on grants is the 990-PF tax return, and this tends to be less complete than other forms of grant reporting.)
The arts compared to other foundation fields of giving. The three largest categories of support tracked by Foundation Center are program support, general operating support, and capital support. Of these, special programs and projects typically receive the largest share of arts and culture grant dollars and grants. In fact, the same is true in most of the major fields, such as health and education, where program support consistently accounts for the largest share of funding.
General operating support accounted for the second largest share of arts grant dollars, accounting for 27 percent in 2013. This share surpassed the overall share directed to operating support by FC 1000 foundations. Moreover, the proportion of arts grant dollars allocated to this type of support was markedly higher than it was in the past. For example, operating support represented only 13 percent of arts funding in 1989.
Capital support accounted for the third largest share of arts grant dollars. Similar to general support, the share of grant dollars allocated for this type of support was also higher for arts and culture (20.2 percent) than for grants overall. Grants for capital support are larger on average than awards for program and general operating support, and exceptionally large capital grants can have a pronounced effect on the distribution of funding by type of support. In fact, arts dollars allocated to capital support have fluctuated more than arts dollars to the other two primary categories of support: based on Foundation Center’s former Grants Classification System, in 1986 the share allocated to capital was about 44 percent; in 1993 it was about 30 percent; and in 1999 it was about 41 percent. (In general, the share of capital support is highest in periods of strong foundation asset growth.)
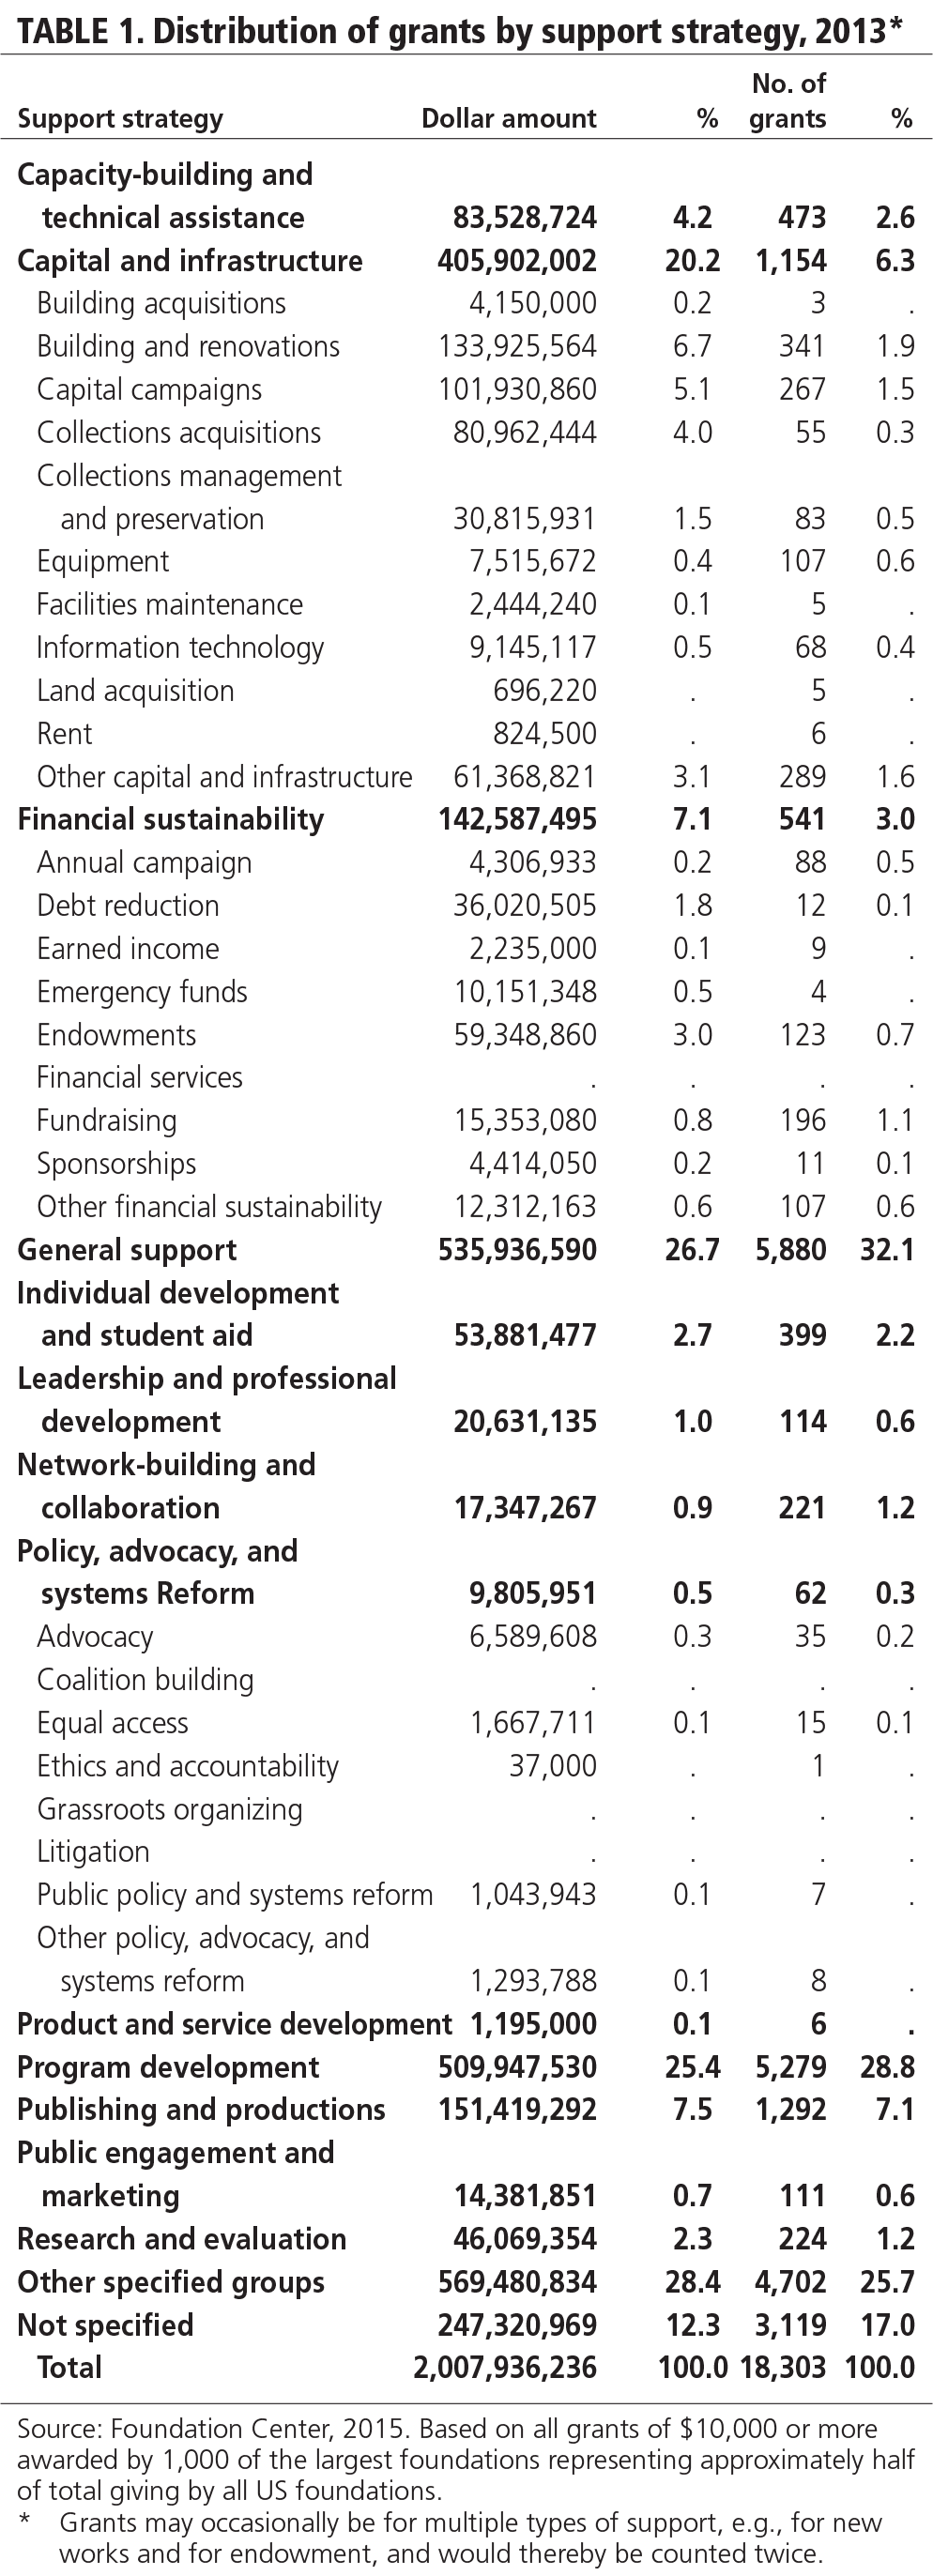
Arts grants by specific types of support. Table 1 provides a breakdown of more specific types of support within the larger support categories and lists both the specific dollar value and number of grants made in each type. As with all data in the “Snapshot,” it is important to keep in mind that this table includes only grants of $10,000 or more awarded to organizations by a sample of the top 1,000 foundations by total giving. It is also important to note that approximately 12 percent of the arts grant dollars in this sample were not specified for a support strategy.
Grants by Grant Size
Median grant size. The median or “typical” grant amount for arts and culture in 2013 was $25,000, which was below the median amount for all foundation grants ($30,000).6 Based on Foundation Center’s former Grants Classification System, the median amount for arts and culture has remained consistent at $25,000 since the early 1990s. More study would be required to determine whether the unchanged median means that foundation arts grants simply are not keeping pace with inflation, or whether, in combination with the increased number of grants, it means that foundations are choosing to distribute funds more broadly to a larger number of recipients.
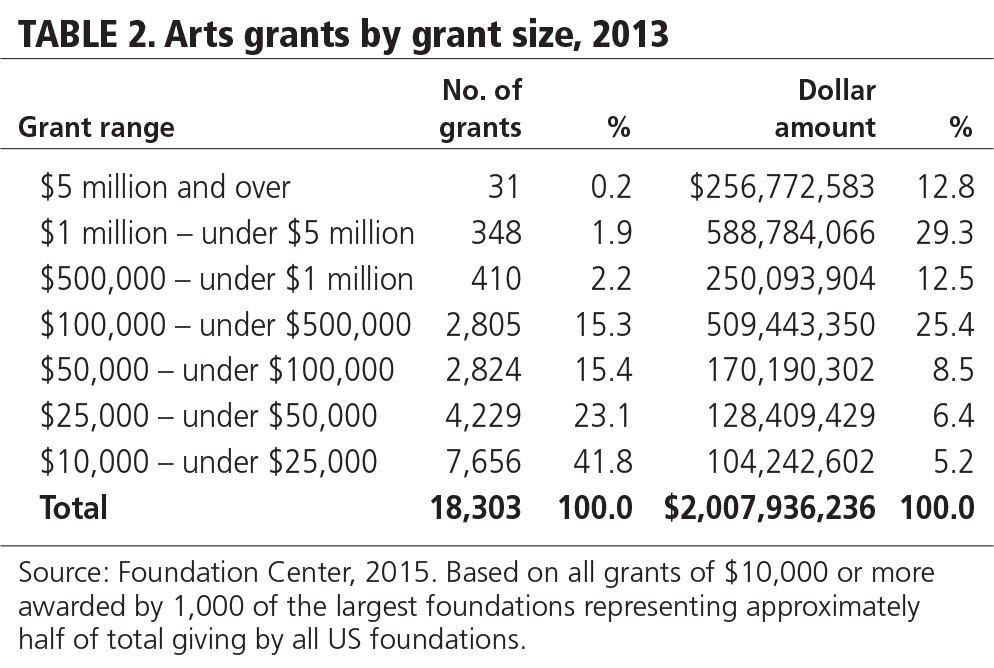
Small and midsized grants. Roughly two-thirds (64.9 percent) of all arts grants in the 2013 sample were for amounts between $10,000 and $49,999 (table 2), nearly unchanged from the 2012 share. The share of midsized arts grants ($50,000 to $499,999) also remained fairly consistent at about 31 percent.
Large grants. The share of larger arts grants ($500,000 and over) went up slightly to 4.3 percent of the total number of arts grants in 2013, compared to 3.9 percent in 2012. Their share of total grant dollars also increased slightly to 54.6 percent, compared to 52.2 percent in 2012. Overall, foundations in the sample made eighty-nine arts grants of at least $2.5 million in 2013, down slightly from 2012.
In addition to the $4.1 million award from the New York–based Doris Duke Charitable Foundation to the Creative Capital Foundation (noted earlier), examples of other especially large grants in the 2013 set included the Annenberg Foundation’s $10 million capital grant for restoring and building the Wallis Annenberg Center for the Performing Arts; Walt and Lilly Disney Foundation’s $8.7 million grant to the Walt Disney Family Museum for arts programming; and a $4.4 million continuing support grant from The Andrew W. Mellon Foundation to the American Council of Learned Societies for a program enabling nonacademic organizations to appoint PhDs in the humanities to postdoctoral positions.
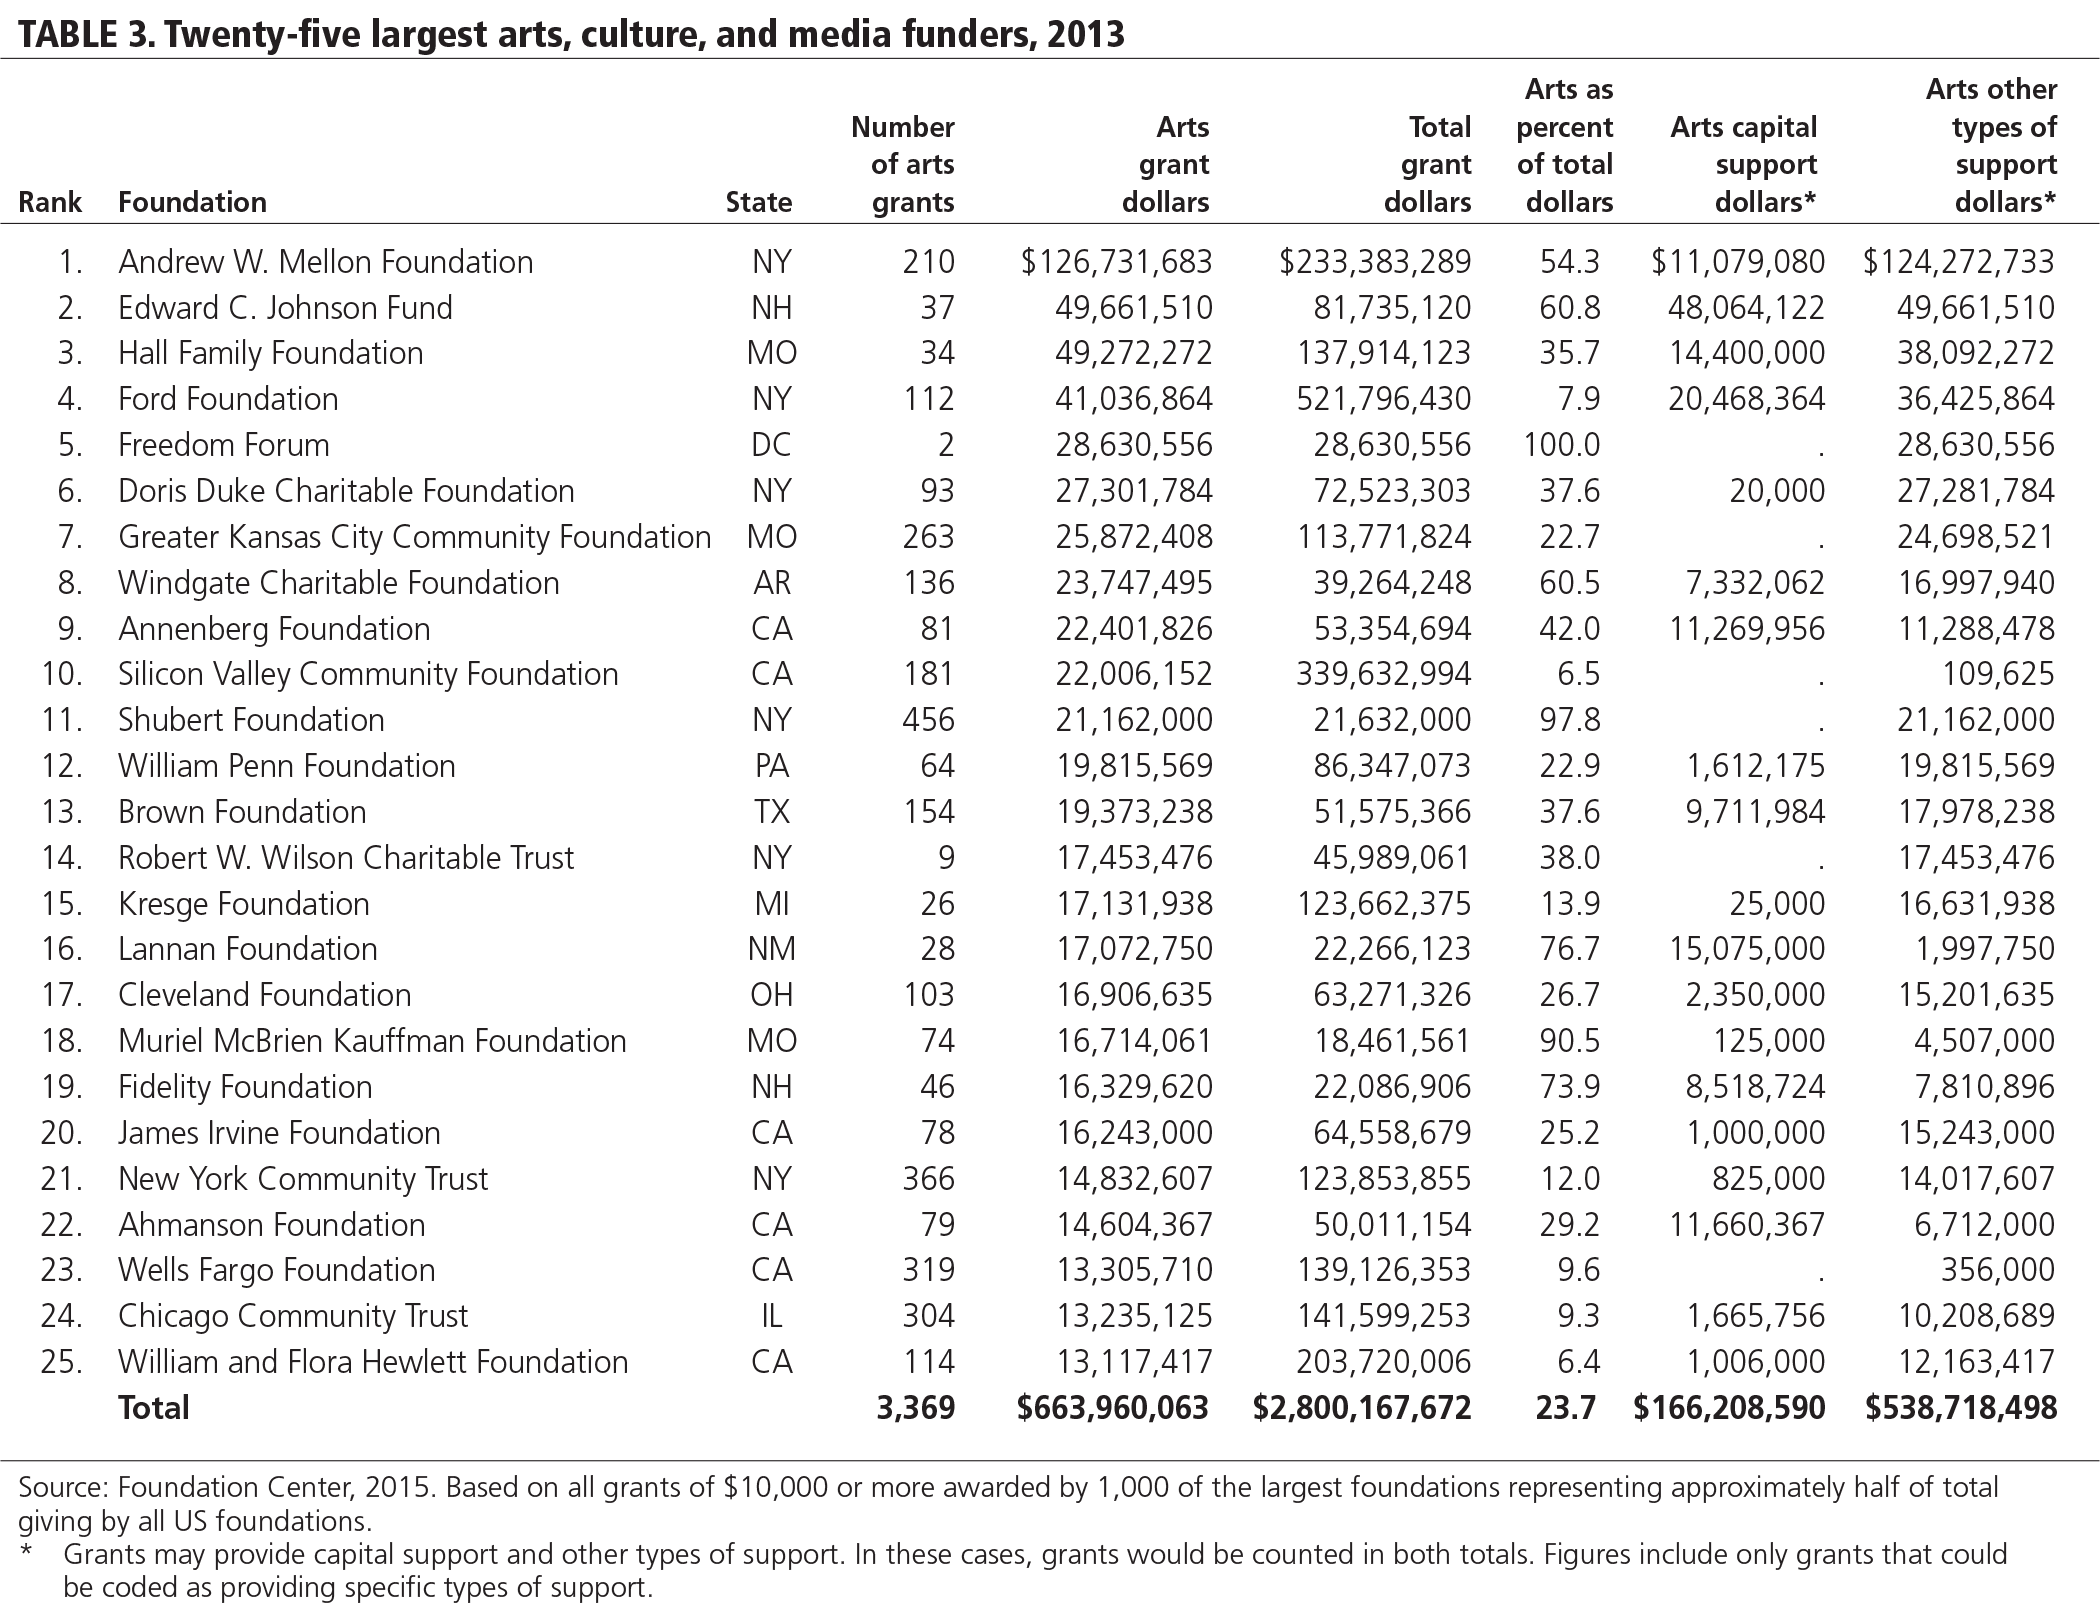
The twenty-five largest arts funders. The top twenty-five arts funders by giving amount provided 33.1 percent of the total arts dollars in Foundation Center’s 2013 sample (table 3), down from 37.3 percent in 2011. Overall, based on the previous Grants Classification System’s definition of arts and culture, the share of giving accounted for by the top twenty-five arts funders has fluctuated between 33 and 39 percent since the end of the 1990s. By comparison, in the early 1980s, the top twenty-five arts funders accounted for more than half of the grant dollars in the sample. This suggests that the base of large arts funders has widened since that time, making arts funding less concentrated among a small number of foundations.
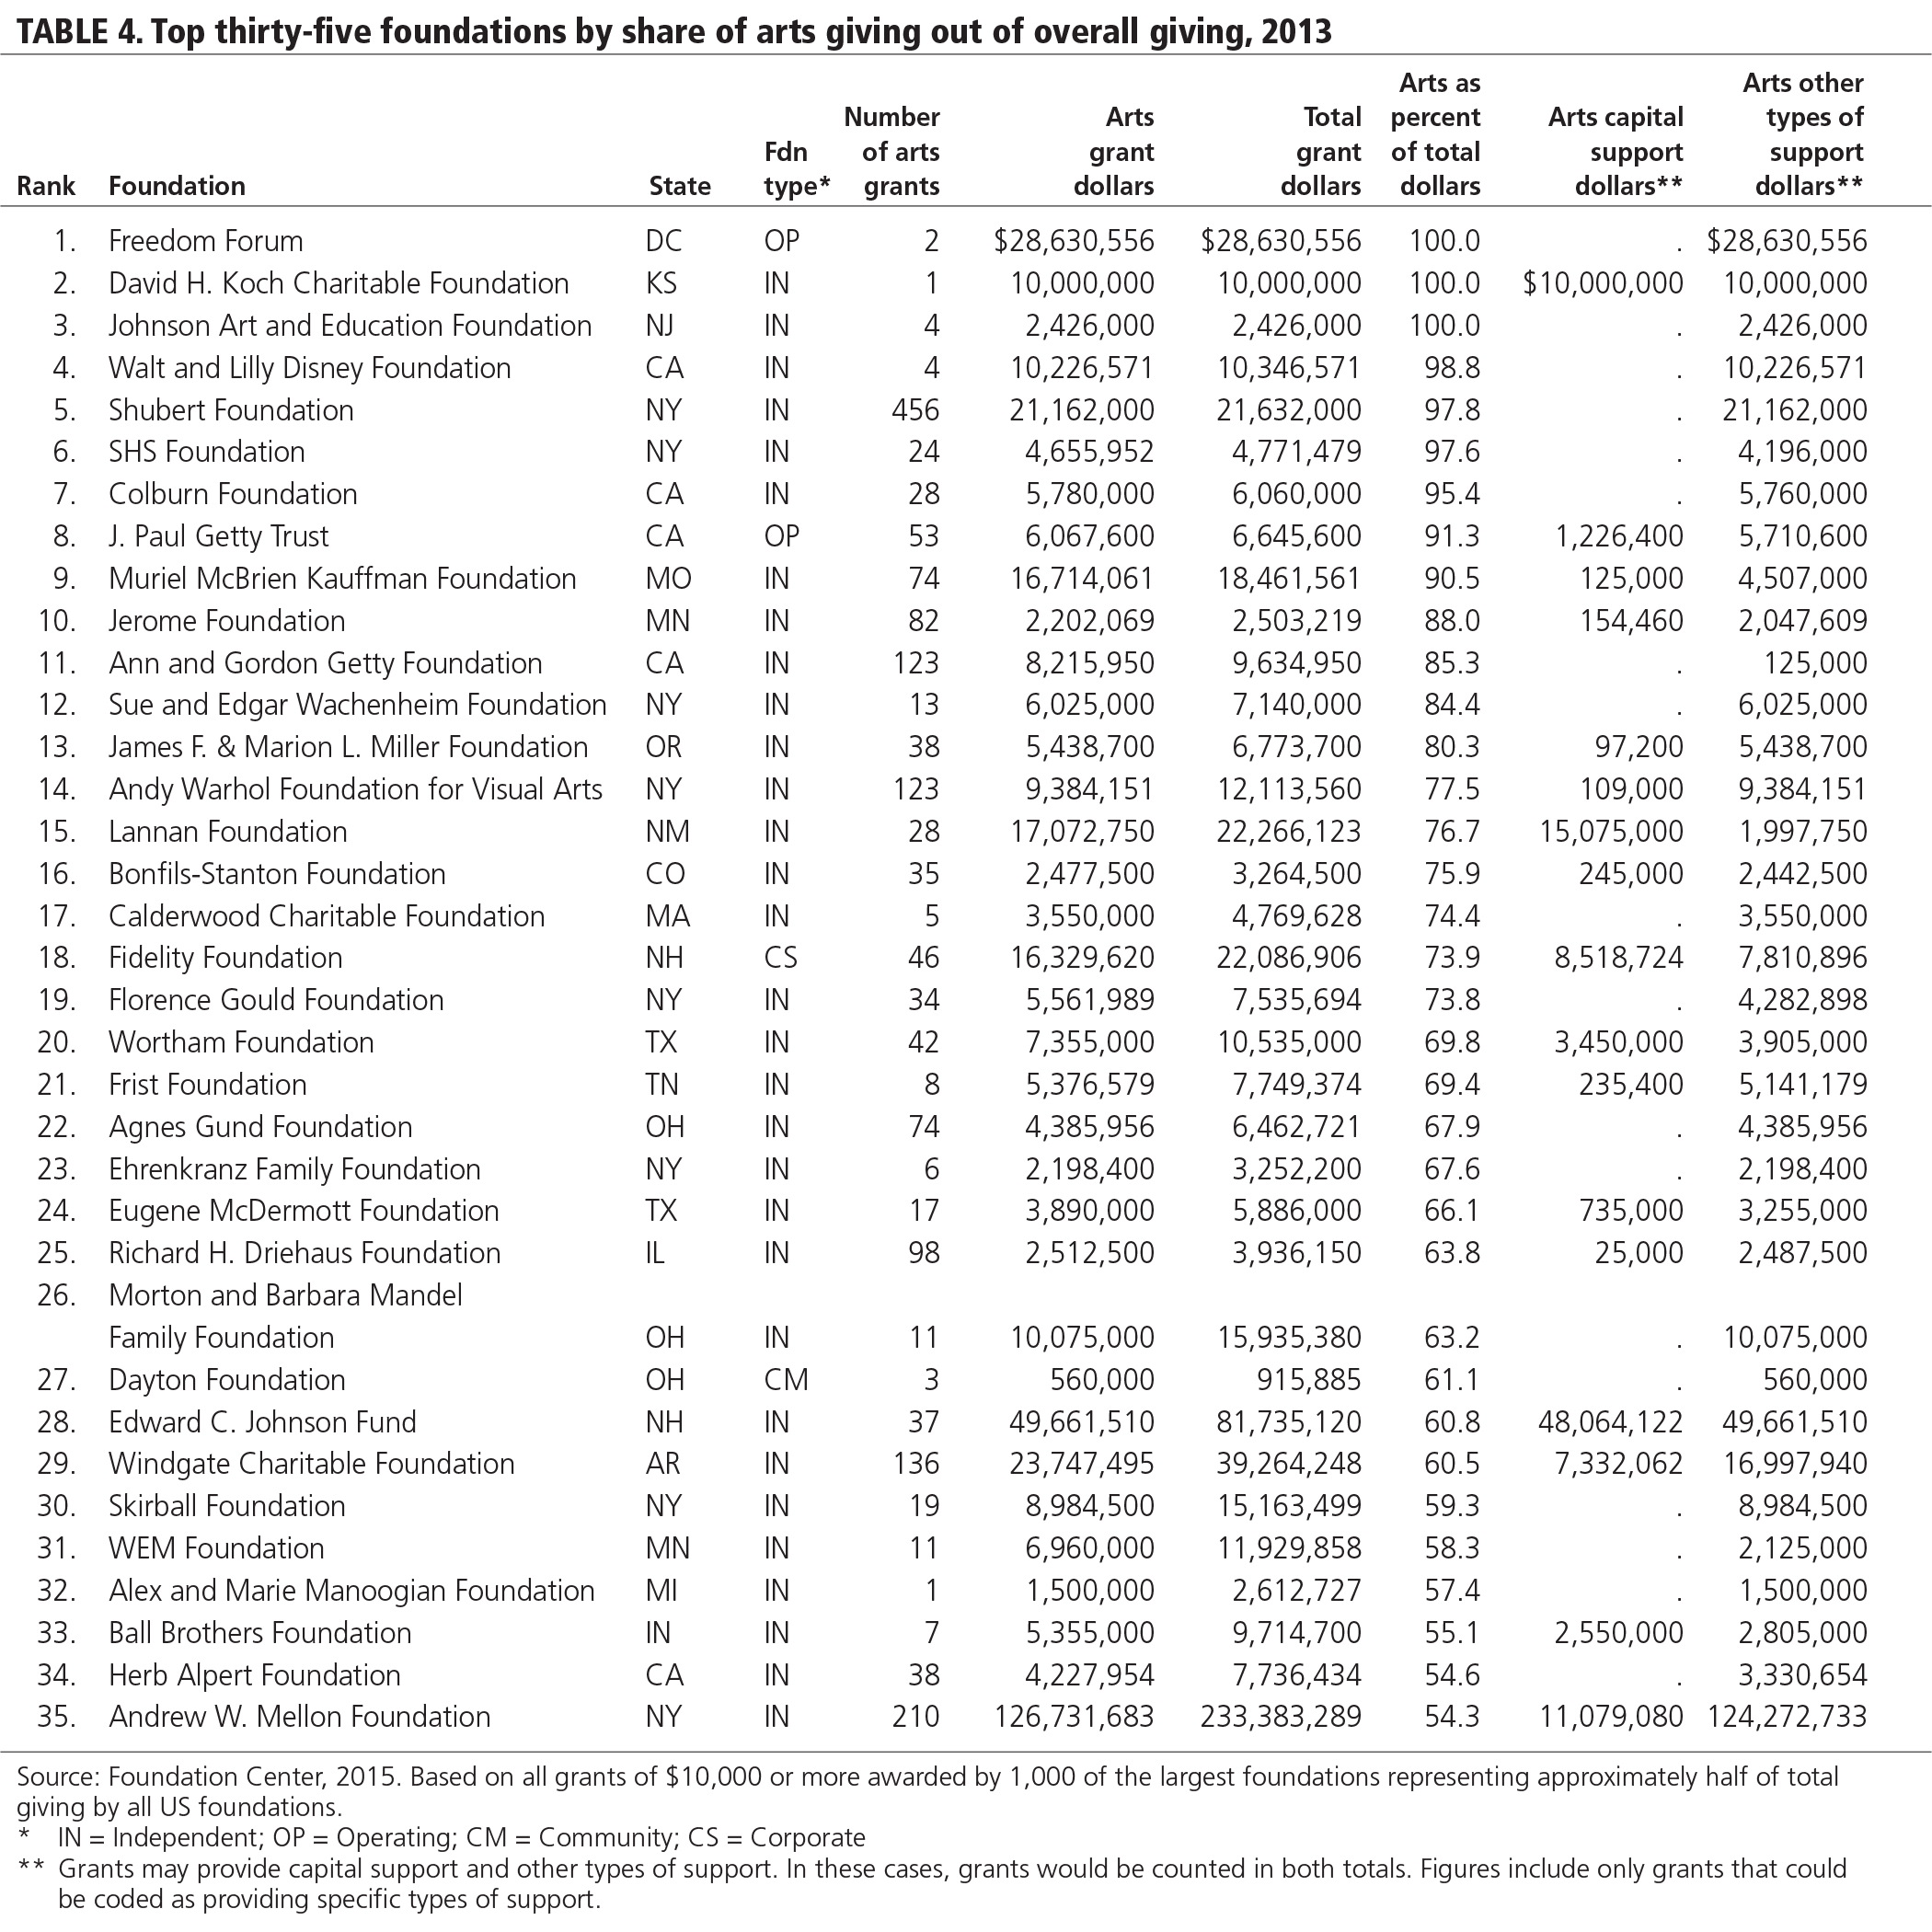
Top foundations by share of arts giving out of overall giving. Of the foundations that committed large percentages of their grant dollars to arts and culture, many are the smaller foundations in the sample (table 4). Among the top one hundred foundations ranked by share of arts giving out of total giving, over half of these foundations (fifty-six) gave less than $5 million in total arts grant dollars in 2013.
Giving for International Cultural Exchange
Grant dollars supporting international cultural exchange decreased roughly 70 percent between 2012 and 2013. In 2013, foundations awarded sixty-seven grants related to international cultural exchange totaling $6.8 million. The largest award was a $1.4 million general support grant from the New York–based Mark and Anla Cheng Kingdon Fund to the China Institute in America. The organization advances a deeper understanding of China through programs in education, culture, business, and art in the belief that cross-cultural understanding strengthens the global community. By comparison, the largest grant reported in 2012 for international cultural exchange was a $10.8 million grant from the Ford Foundation to the Institute of International Education’s Global Travel and Learning Fund to administer travel awards and other program-related learning activities.
NOTES
- Media and communications (now called information and communications) are no longer captured under arts and culture.
- Source of the data: This analysis is based on the Foundation Center’s 2013 FC 1000 set, which includes all of the grants of $10,000 or more reported by 1,000 of the largest US independent, corporate, community, and grantmaking operating foundations by total giving. For community foundations, the set includes only discretionary grants and donor-advised grants (when provided by the funder). The set excludes grants to individuals. This set accounts for approximately half of giving by all of the more than 87,000 active US grantmaking foundations. Grant amounts may represent the full authorized amount of the grant or the amount paid in that year, depending on the information made available by each foundation.
- Includes support for archaeology, art history, modern and classical languages, philosophy, ethics, theology, and comparative religion.
- Includes support for multidisciplinary centers, arts councils, artist’s services, arts administration, arts exchange, and arts education.
- With the transition to Foundation Center’s new Philanthropy Classification System, the way in which foundations are making use of different strategies to support their funding has been revised to include more areas of support.
- The median — meaning that half of the grants are above and half are below the amount — is generally acknowledged to be a more representative measure of the typical grant than the mean or “average,” because the median is not influenced by extreme high or low amounts.