An Exploratory Study of Demographic Diversity in the Arts Management Workforce
Arts managers connect audiences to the greatest artistic achievements of humankind. Yet, the cultural sector and public know little about their demographic makeup in the United States. A paucity of literature exists on arts managers (Americans for the Arts 2013; DiMaggio 1987; Herron et al. 1998; Mankin et al. 2006), and questions pertinent to assessing the current level of demographic diversity in the arts management workforce remain unexplored.
Given demographic trends, a lack of diversity remains one of the most important issues for the cultural sector to address in the twenty-first century. From 1980 to 2010, the US population shifted from 76 percent white to 63 percent white. According to the US Census Bureau, by 2042 people of color will become the majority, and whites will become the minority (Americans for the Arts 2013; Dubose 2014; Tran 2015). If the US Census Bureau’s projections are correct and diversity will increasingly characterize the population, then the cultural sector should take action to reflect the society in which it exists, starting with evaluating the current level of demographic diversity in the arts management workforce. Toward this goal, this study describes the occurrence of disability among current arts managers and their ethnicity and race, gender, and sexual orientation. In addition, this study makes recommendations for future studies and discusses the role of funders in helping to address the problem of diversity in arts management.
Methodology
I used Qualtrics to develop an anonymous, cross-sectional, online descriptive survey based on previous studies (Americans for the Arts 2013; DiMaggio 1987). To test the survey instrument’s reliability and validity, I piloted the instrument before collecting data from June 11 through September 12, 2014. I disseminated the survey to the American Alliance of Museums, the National Assembly of Arts Agencies, and the Performing Arts Alliance.
The Performing Arts Alliance includes service arts organization such as the Association of Performing Arts Presenters (APAP), Dance/USA, League of American Orchestras, OPERA America, Theatre Communications Group, Alternate ROOTS, American Composers Forum, Chamber Music America, Chorus America, Fractured Atlas, National Alliance for Musical Theatre, National Association of Latino Arts and Culture, National Performance Network, Network of Ensemble Theaters, and New Music USA. To ensure that more arts managers had an equal opportunity to participate in this study, I also advertised the study on the Arts Journal website for two weeks. I used descriptive statistics to analyze and report the results.
Results and Discussion
Building on Past Studies
In the earliest study of arts managers (N = 518), DiMaggio (1987) examined their backgrounds, careers, rewards they received from their work, expectations for future employment, training, evaluation of that training, professional participation, and attitudes on specific management and policy issues. Although critical to developing the conceptual framework for broadly studying arts managers, this study is more than twenty-five years old. It also included only executive-level arts managers working full-time. In my study (N = 575), 82 percent of the sample work full-time, and 18 percent work part-time. Fifty percent are middle managers; 33 percent, executive managers, and 17 percent, entry-level managers.
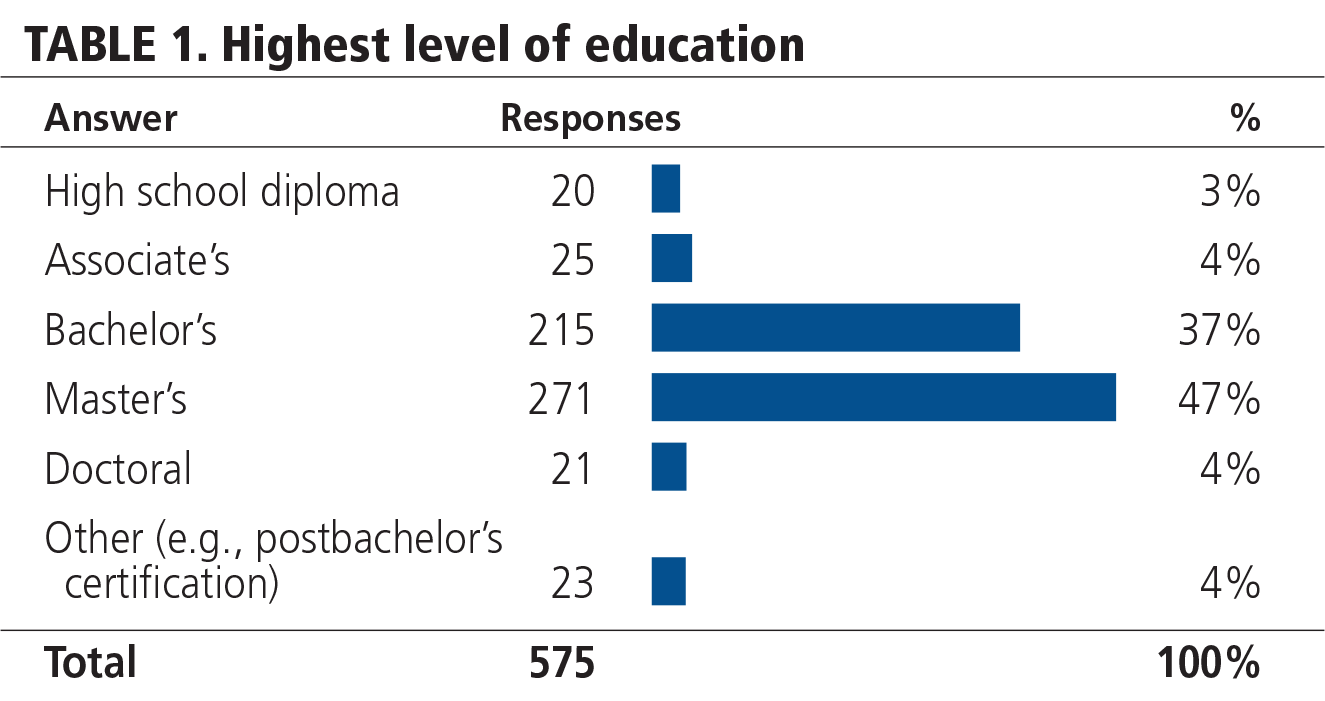
More recently, Americans for the Arts (2013) studied the salaries of arts managers who work in local arts agencies (N = 753). Approximately, 86 percent of the full-time respondents self-identified as white, and 72 percent as female. Full-time employees earned an average annual salary of just over $66,000. Similar to the sample in my study (see table 1), more than 90 percent earned a college degree. Not surprisingly, 92 percent of the executive directors or CEOs identified as white.


Demographic Data
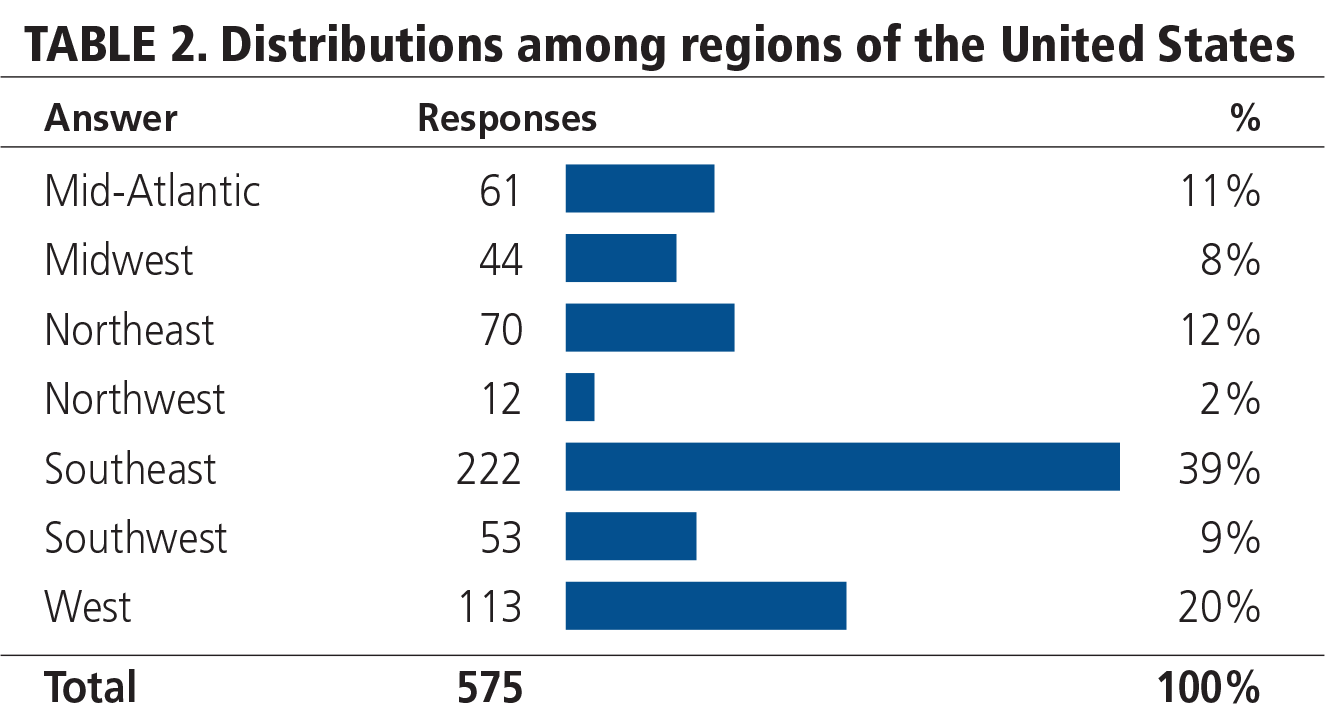
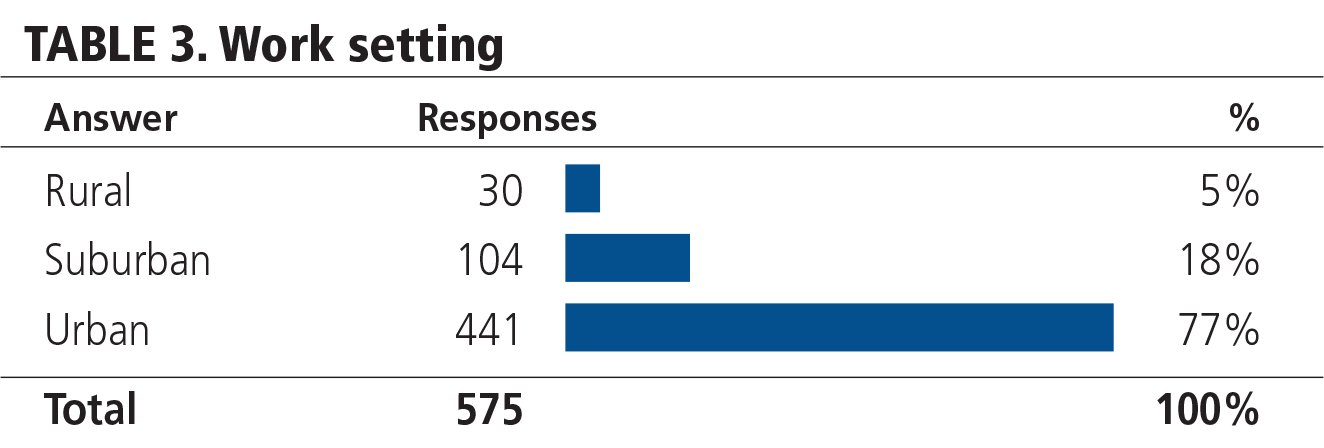
Although DiMaggio (1987) and Americans for the Arts (2013) have made significant contributions to the knowledge on arts managers, my study focused on providing more data about the demographic diversity of arts managers. Table 2 shows the national scope of the sample. Most participants, 77 percent, work in an urban setting (see table 3).
Table 4 illustrates the types of organizations in which participants work. Most arts managers work in museums, theaters, orchestras, and service arts organizations. However, 28 percent of participants selected “other” and listed arts advocacy organization, local arts agency, and state arts agency, among others, as types of organizations in which they work.
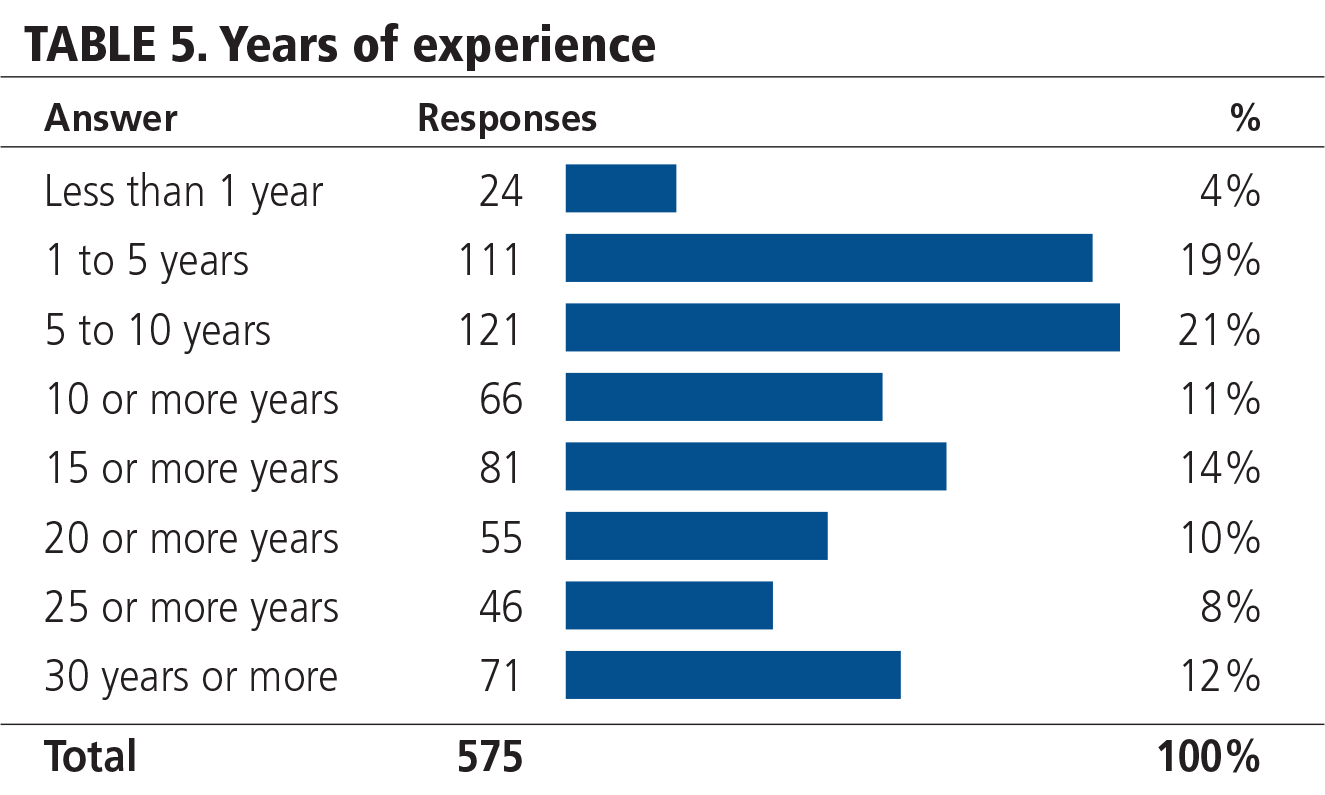
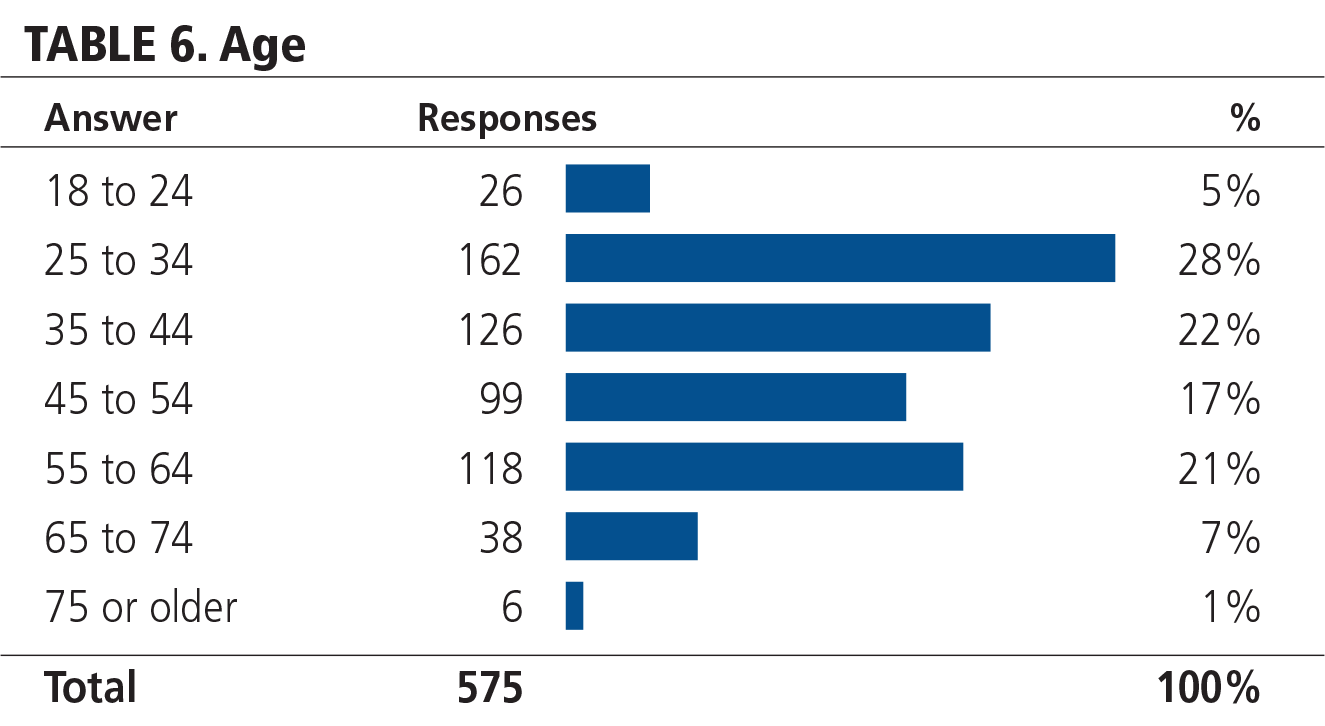
Table 5 displays the participants’ years of experience. Almost 40 percent had one to ten years of experience, and 20 percent have worked in arts management for twenty-five or more years. Table 6 shows that approximately 50 percent of participants are age twenty-five to forty-four.
Disability
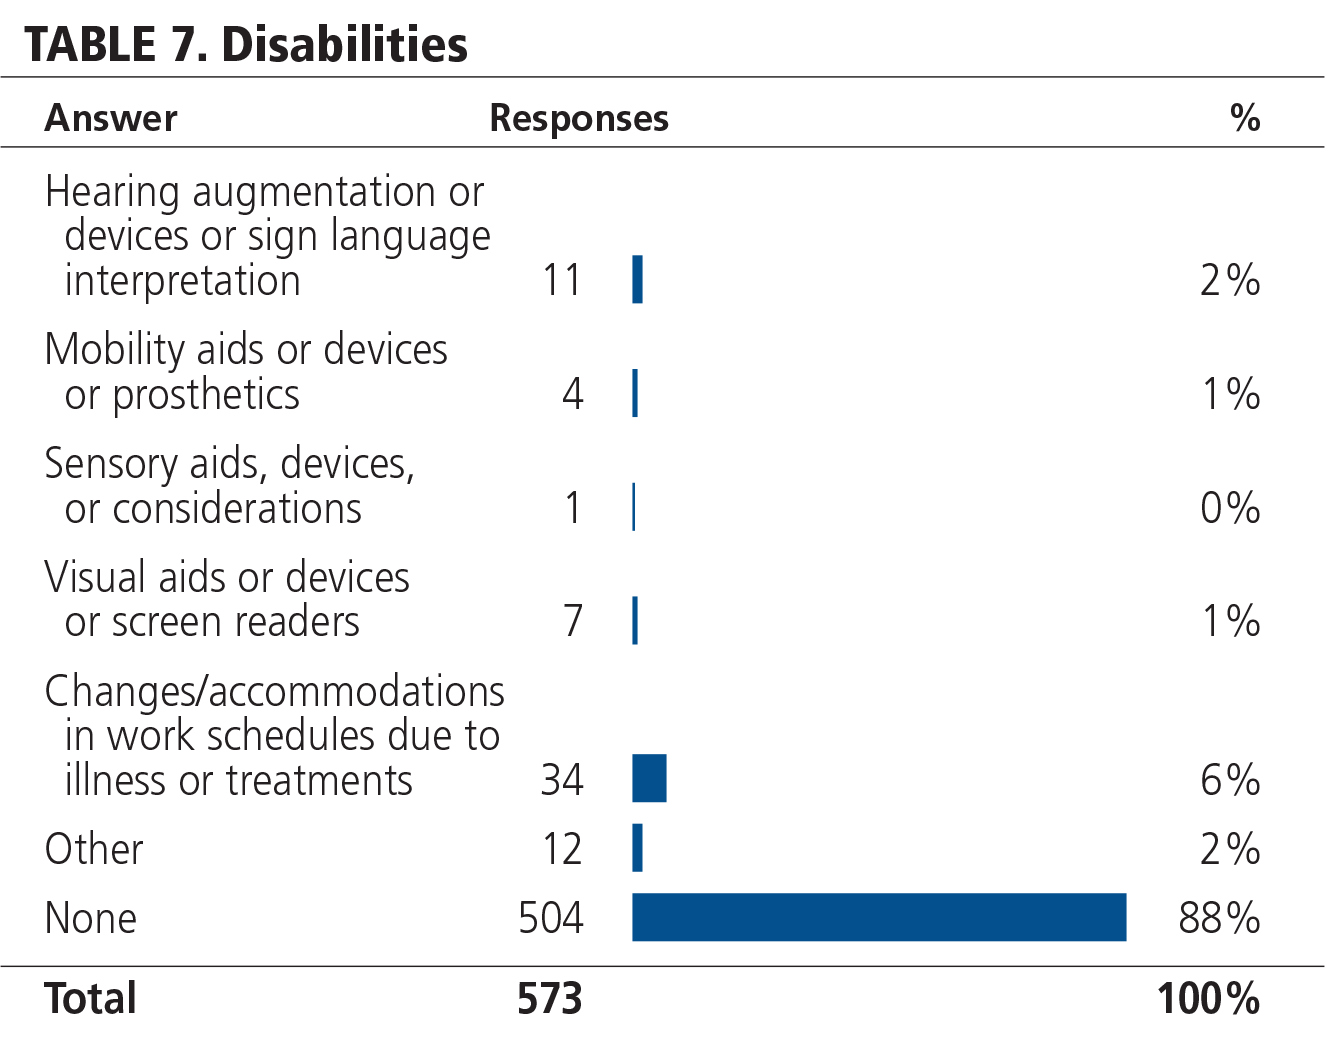
About 12 percent of participants reported having a disability, while 88 percent reported having no disability (see table 7). Most participants who reported a disability, 6 percent, required accommodations in work schedules due to illness and treatments.
According to the US Census Bureau (2012), 56.7 million people, or 19 percent of the population, had a disability in 2010. In addition, 41 percent of those age twenty-one to sixty-four with any disability had employment, compared with 79 percent of those with no disability. To more accurately reflect the US population, arts management needs to improve its efforts to recruit more people with disabilities. Increased visibility of people with disabilities within arts management may enhance the cultural sector’s ability to engage this population as artists and audience members.
Ethnicity and Race
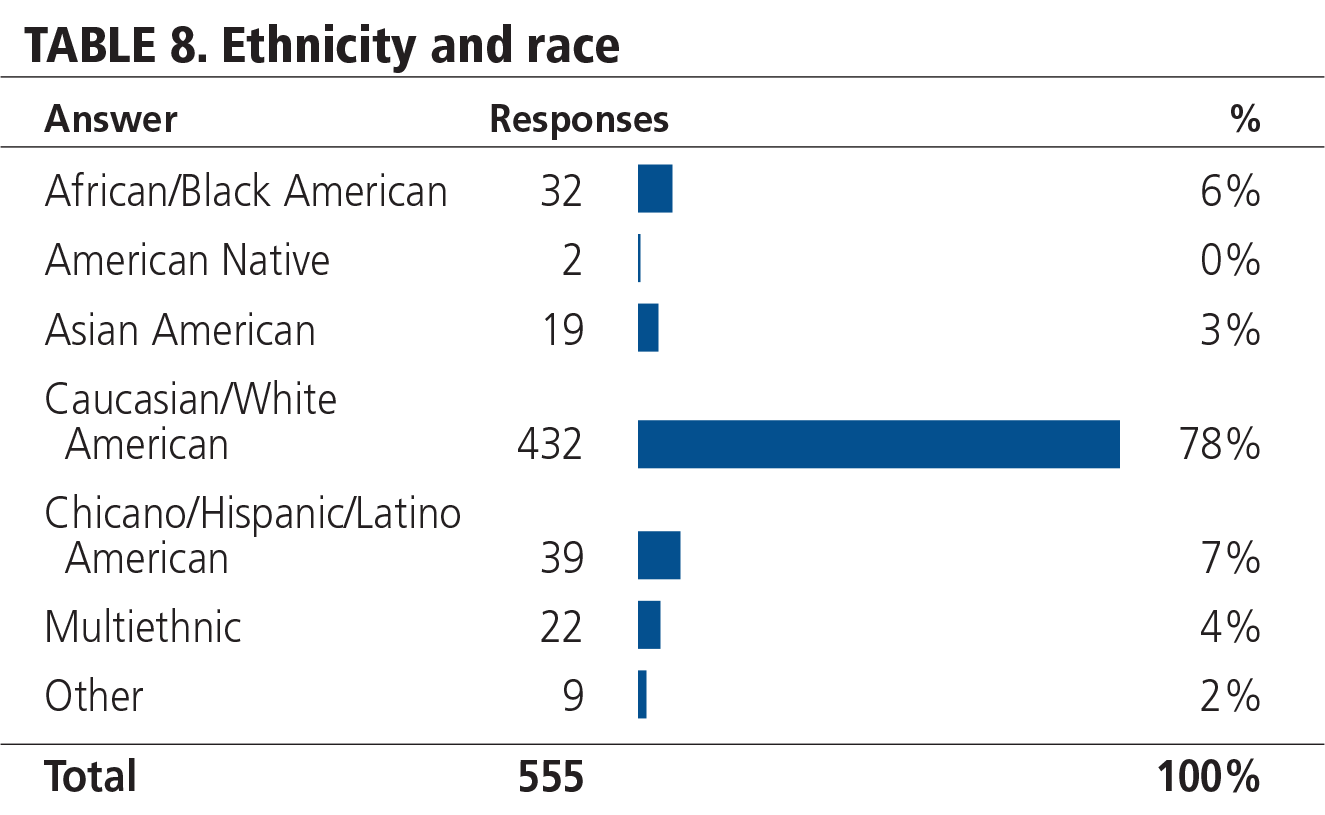
The US population is ethnically and racially diverse. Roughly, 63 percent is white; 17.1 percent, Hispanic/Latino; 13.2 percent, African American; 5.3 percent, Asian; 1.2 percent, American Native; and .2 percent, Native Hawaiian (US Census Bureau 2015). The most significant finding from this survey question is that 78 percent of arts managers identified as white (see table 8). These results show that the arts management workforce does not accurately reflect US society. To change this, arts management should recruit more people of color. Diversity programs in arts management would seem a viable strategy (Cuyler 2015). However, these programs should undergo continuous and rigorous evaluation to determine their efficacy in yielding more ethnic and racial diversity in arts management.
Gender
Seventy-seven percent of survey participants are female, and 23 percent are male. Only two participants identified as transgender. The arts management workforce may need to consider ways to recruit more men into the profession. Yet, research has shown that gender negatively affects the careers of women in arts management. Herron et al. (1998) conducted a national study of arts managers in medium-sized dance companies, museums, opera companies, symphonies, and theaters to determine the effect gender has on the career mobility of arts managers. They found that men predominantly held upper-management positions and earned significantly higher salaries than women, and thus they concluded that a glass ceiling exists in arts management for women.
Americans for the Arts (2013) found that women in local arts agencies are about 6 percent less likely to hold the top position than are men. If women do hold the top office, they do so at smaller organizations. Overall, women in the study earned an average of $6,500 less than males. Even more disturbing, female executive directors earned an average of $18,000 less per year than males. This is partly because the largest and best-compensating local arts agencies have too few women in top positions. Furthermore, Cuyler and Hodges (2015) found that more female students, 40 percent, than male, 13 percent, disagreed that they would work harder during a paid as opposed to an unpaid internship, while more males than females agreed or strongly agreed that they would work harder during a paid internship (36 percent and 32 percent versus 23 percent and 23 percent).
The results speak volumes about how US society has socialized women to work. Arts management should do more to assist women in their career advancement. This might include programs that encourage women to pursue careers in executive arts management. The profession should base these programs on evidence-based research that examines gender, job satisfaction, and salary equity.
Sexual Orientation
Previous studies of arts managers did not ask about sexual orientation (Americans for the Arts 2013; DiMaggio 1987; Mankin et al. 2006). Table 9 shows that 85 percent of participants identified as heterosexual, 14 percent as LGBTQ+, and 1 percent as asexual. A recent study from the Centers for Disease Control (CDC) estimates that almost 5 percent of the US population identifies as same-sex loving (Ward et al. 2014). If the CDC is correct, then arts management exceeds representation of nonheterosexuals by 10 percent. Given this success, arts management should investigate if barriers remain for sexual minorities and why.
Conclusions
Although this study provided a current assessment of the demographic diversity within the arts management workforce, limitations exist. I partially drew the sample for this study from the memberships of service arts organization. This may have served as a barrier to participation in the study for arts managers who are not members of a service arts organization. To broaden the sample beyond members of service arts organizations, I advertised participation in the study in the Arts Journal for two weeks. Future studies of this nature should consider numerous ways of incentivizing participation. Regrettably, I did not receive funding to extend advertisements beyond two weeks or to provide such incentives and thus depended heavily on the benevolence of the participants.
In addition to presenting the results, I suggested future studies. Four studies in particular will significantly enhance knowledge of diversity within the arts management workforce. These include investigation of the following questions:
- Do arts managers’ benefits, job satisfaction, managerial position level, and salary differ based on disability, ethnicity and race, gender, or sexual orientation, and if so, how?
- What effect does disability, ethnicity and race, gender, and sexual orientation have on the career advancement of arts managers?
- Do barriers exist to careers in arts management for sexual minorities, and if so, why?
- What is the efficacy of diversity programs in arts management?
Based on this research, arts management has a more informed position to follow Dang’s (2015) example and develop a profession-wide plan that includes the following SMART goals over the next five years up to 2042:
- People with disabilities will make up 19 percent of the arts management workforce.
- People of color will make up at least 37 percent of the arts management workforce with an end goal toward 50 percent.
- Women will receive pay equal to that of their male counterparts and make up at least 50 percent of the executives in arts management.
The Role of Funders
This study provides a current assessment of the demographic diversity within the arts management workforce and also suggests sound actions to engage the cultural sector in addressing the problem of diversity. Arts funders can play a critical leadership role by explicitly and strategically encouraging, incentivizing, and supporting diversity within arts management.
A convening of a national task force of funders, educators, practitioners, and scholars working together could further refine and implement the plan articulated here. Providing funding for technical assistance on how to implement effective practices proven to lead to greater diversity could benefit arts management as well. For example, the lack of diversity in arts management classrooms has challenged educators too. Arts management students very closely resemble the participants in this study (Cuyler 2013). Arts management educators could take a more proactive role in diversifying their student bodies with the right kind of assistance. By strengthening the pipeline of diverse arts managers earning degrees, funders will inevitably affect the overall diversity of the workforce.
Ultimately, this national arts management diversity task force would monitor and ensure progress toward the goals. Beyond the task force, funders could support programs and research that will significantly enhance arts management’s efforts to become more diverse.
The diversity problem in arts management has received a considerable amount of attention by arts bloggers. Fear, ignorance, and privilege have delayed progress toward diversity in the field. Given this critical mass of interest, declining participation in the arts, failing arts organizations, and severely underresourced culturally specific arts organizations, now is the time for less talking and more doing to create a more diverse cultural sector.
REFERENCES