Time and Money: Using Federal Data to Measure the Value of Performing Arts Activities
Download:
![]() Time and Money: Using Federal Data to Measure the Value of Performing Arts Activities (163Kb)
Time and Money: Using Federal Data to Measure the Value of Performing Arts Activities (163Kb)
This NEA Research Note examines large datasets from multiple federal sources including the U.S. Economic Census, the Bureau of Economic Analysis (BEA), and the Bureau of Labor Statistics (BLS), to arrive at monetary and non-monetary value measurements of the nation’s performing arts sector. The first section reports the total number, staff, and budget size of performing arts organizations. The second part addresses U.S. consumer spending on performing arts admissions and other cultural events. Part Three takes a different approach. It represents the NEA’s first-ever analysis of Americans’ daily time spent doing arts and cultural activities, including performing arts attendance. This section relies on previously unpublished data from the BLS’ American Time Use Survey. The Note concludes by reviewing several possible measures of arts and cultural value that extend beyond mining federal databases.
Key Findings:
Value as expressed by time use
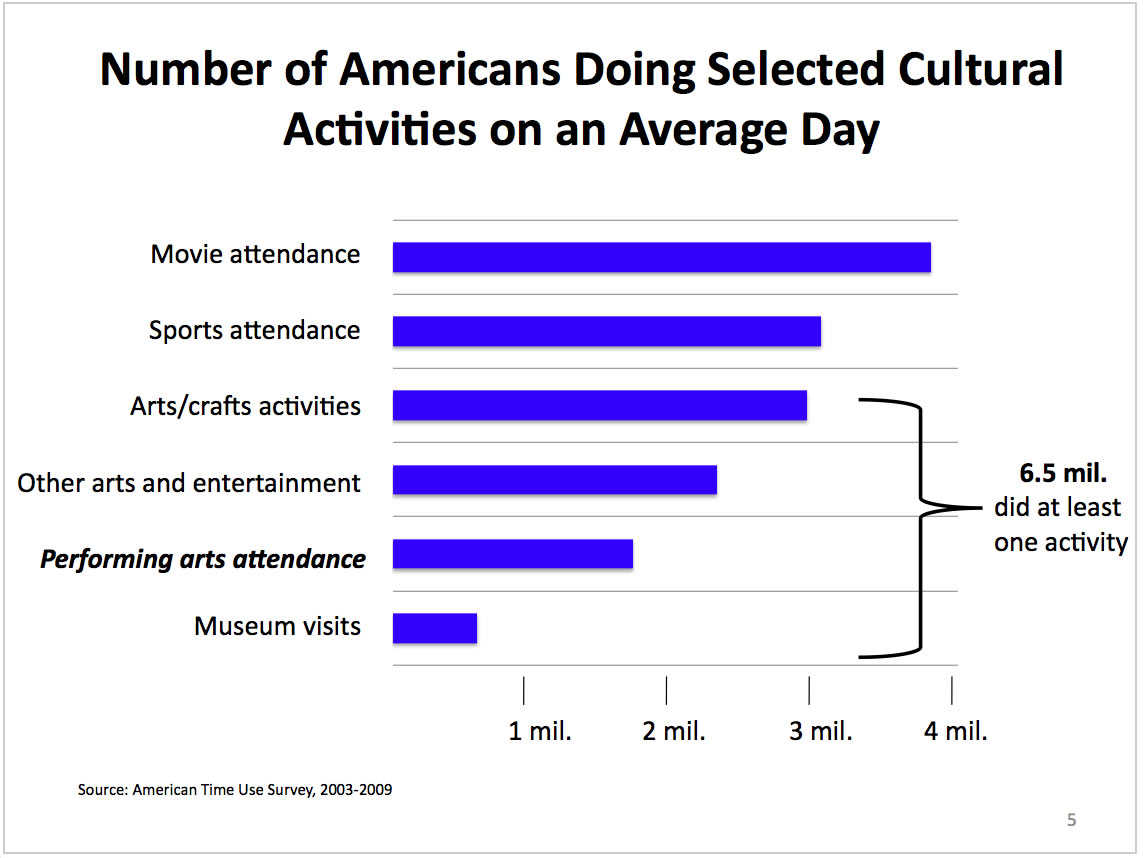
For the first time, the NEA offers a ‘day in the life’ snapshot of how Americans participate in arts and cultural activities. The data was collected through the American Time Use Survey from the Bureau of Labor Statistics, and shows how much time Americans spend on the arts, the time of day selected arts activities are likely to take place, whether the activities were done alone or with others, and where those activities occurred. The research reveals that the arts are often a social, shared experience with friends and family.
- On any given day, 1.5 million Americans attend arts performances, usually with family or friends (41 percent). Attendees spend an average of 2.7 hours at these events, and attendance usually peaks between 8-9 pm.
- Museums draw more than 500,000 per day; most visitors spend 2.4 hours at museums, and attendance peaks during lunch hour. Seventy percent of museum-goers visit with family members.
- On any given day, 2.6 million Americans spend 2.5 hours on arts and crafts activities, including painting, sculpting, photography, scrapbooking, holiday decorations and costume-making, and jewelry-making. Thirty percent do these activities with other family members, and 19 percent, with children.
- In comparison, Americans spend an average of 3.5 hours watching television. People spend an average of 1.5 hours using computers for leisure activities such as surfing the Internet, participating in chat rooms, or downloading music or photographs.
Value as expressed by organizational revenue and expenses
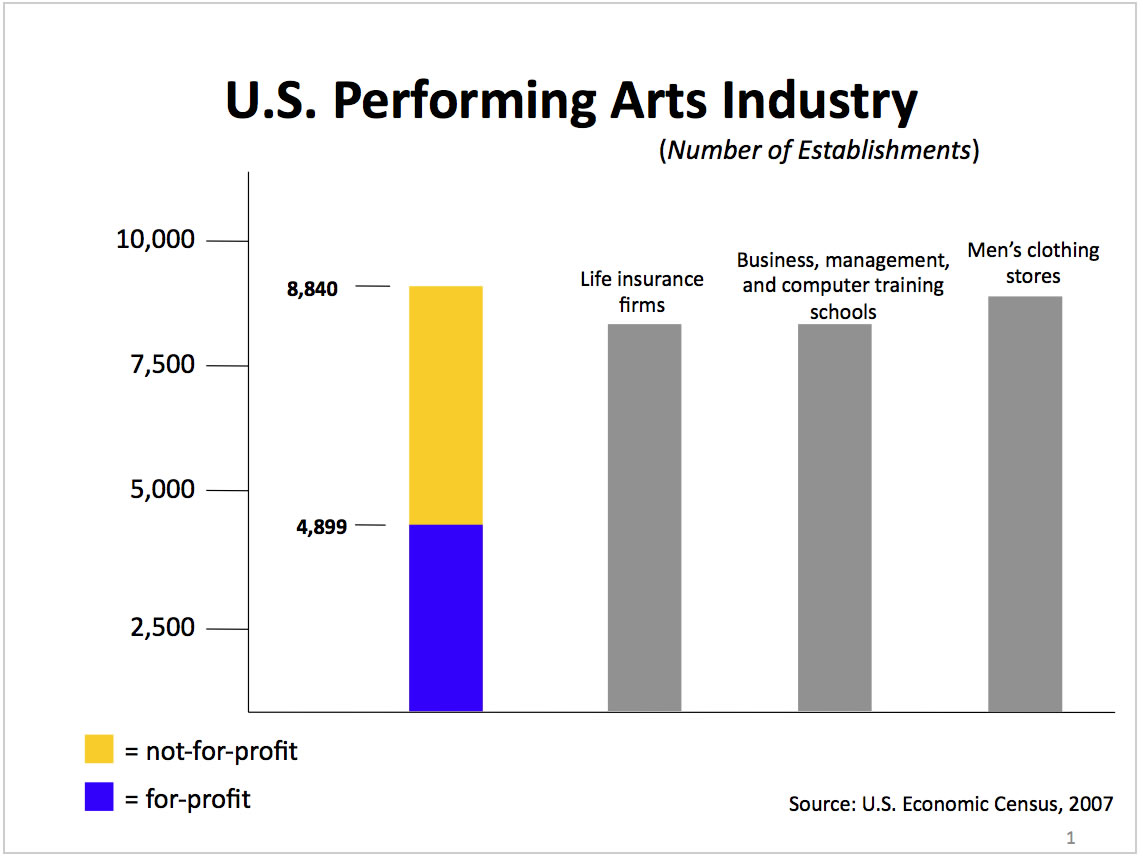
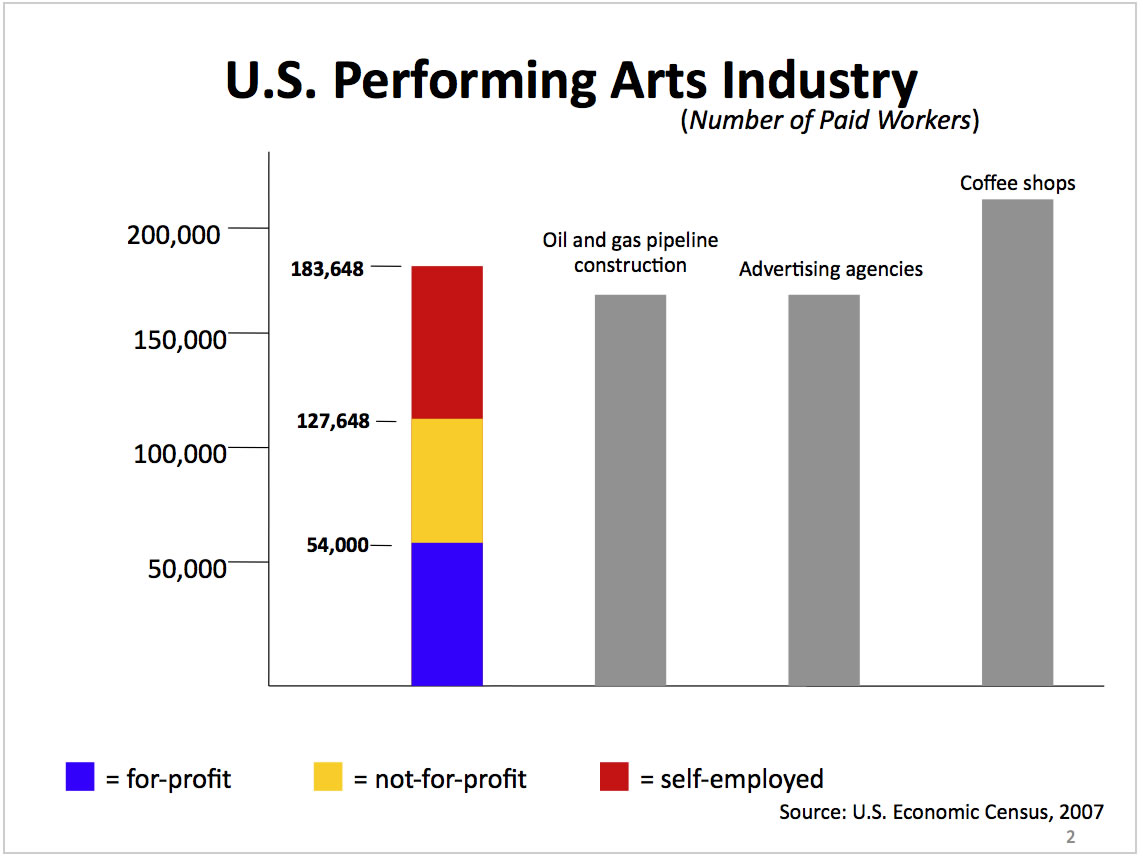
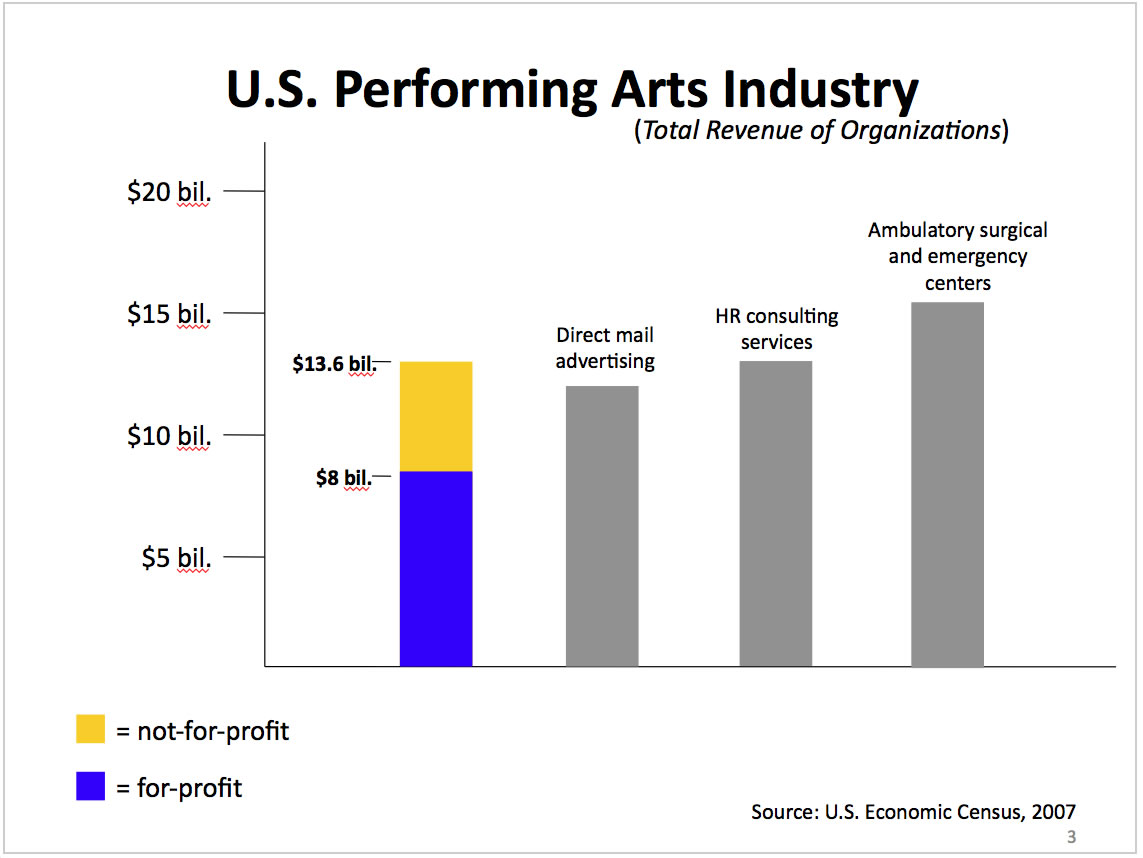
According to the 2007 U.S. Economic Census, the U.S. performing arts industry is supported by nearly 8,840 organizations with a total of 127,648 paid workers. These organizations generate nearly $13.6 billion in annual revenues.
- The not-for-profit sector alone accounted for 45 percent of these organizations (about 4,000) and 58 percent of their paid workers. Total annual revenue and expenses of nonprofit performing arts groups were $5.6 billion and $5.2 billion, respectively.
- Theater and opera companies accounted for just over half of the total revenue and total expenses of all not-for-profit performing arts groups. They also provided over half (38,130) of this sector’s paid employees.
- At not-for-profit performing arts establishments, 46 percent of total revenue comes from admissions, contract fees, and membership services. Contributed income (from individuals, foundations, businesses, and government agencies) makes up 41 percent of all revenues. The largest share of contributed income is from individuals (20.7 percent) and the smallest are from government sources (4.3 percent) and guilds and unions (2.3 percent).
- Nearly one in four not-for-profit performing arts organizations (23.6 percent) have budgets of $100,000 to $249,000; more than half of all not-for-profit performing arts organizations have budgets ranging from $100,000 to just under $1 million.
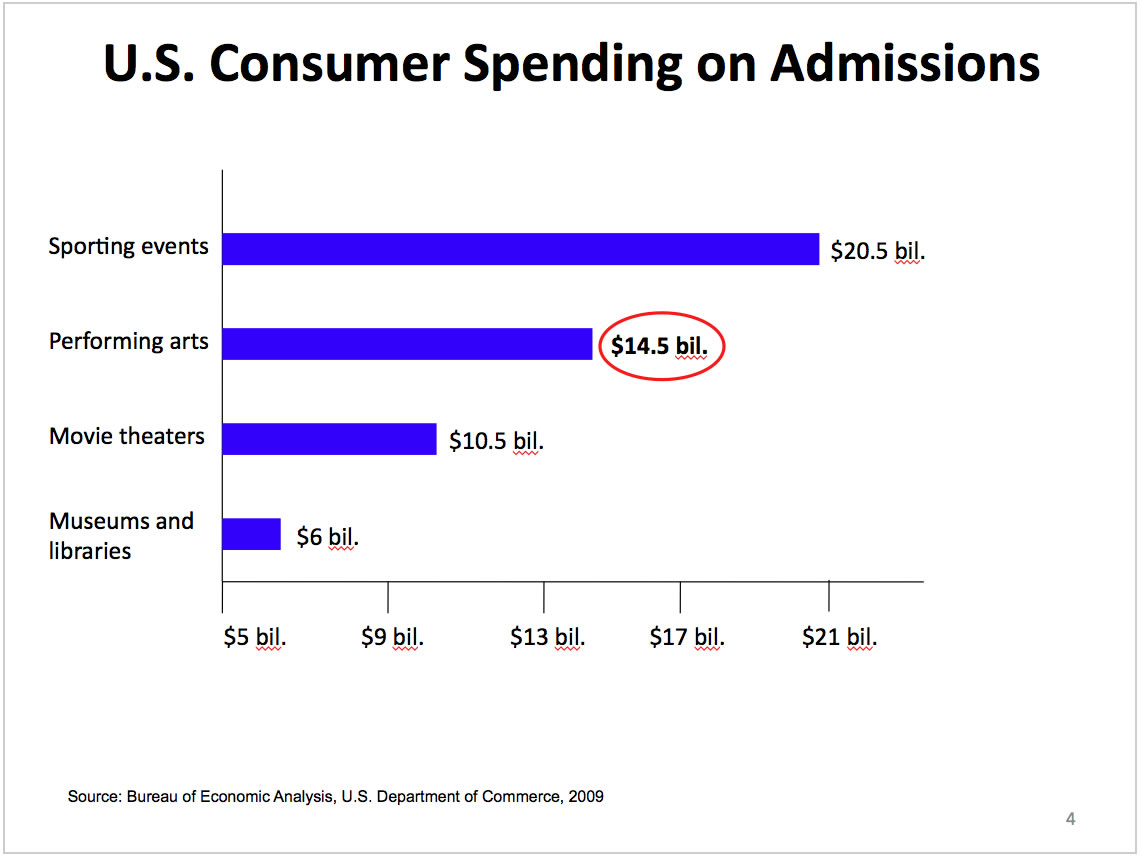
Value as expressed by consumer spending
Americans recently spent an annual total of $14.5 billion on performing arts admissions. This compares to $20.7 billion on sports events and $10.4 billion on movie box-office tickets. The average U.S. household spent $139 annually on arts and crafts, a category that includes toys and (non-video) games. This amount was roughly comparable to that spent on sports and exercise equipment ($130).